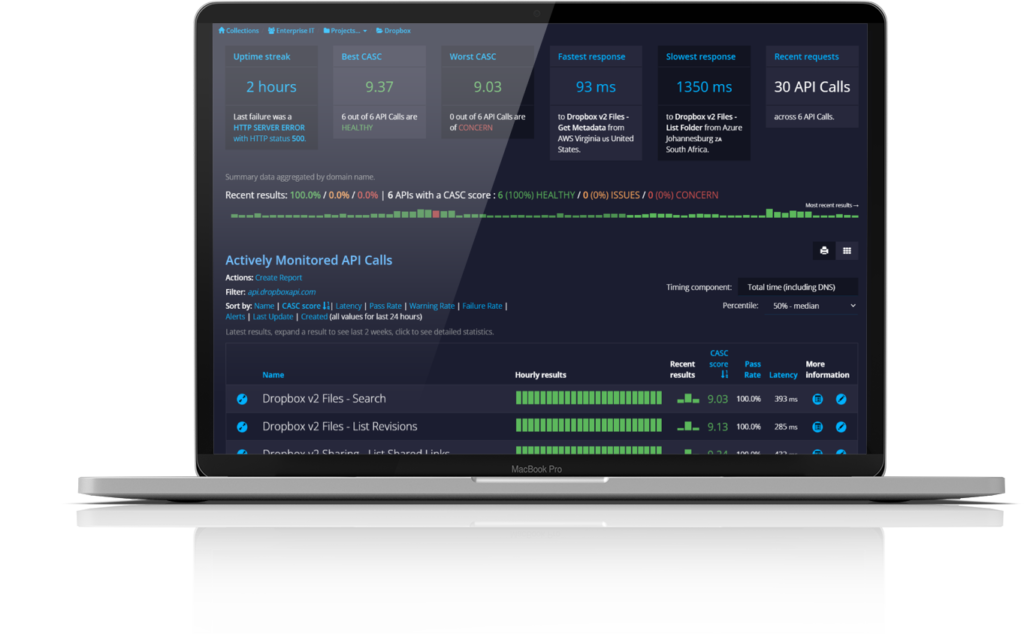
Monitor
Monitor APIs in the runtime where it matters. Get instant alerts for problems.
Secure
Monitor and verify runtime security works as expected 24/7.
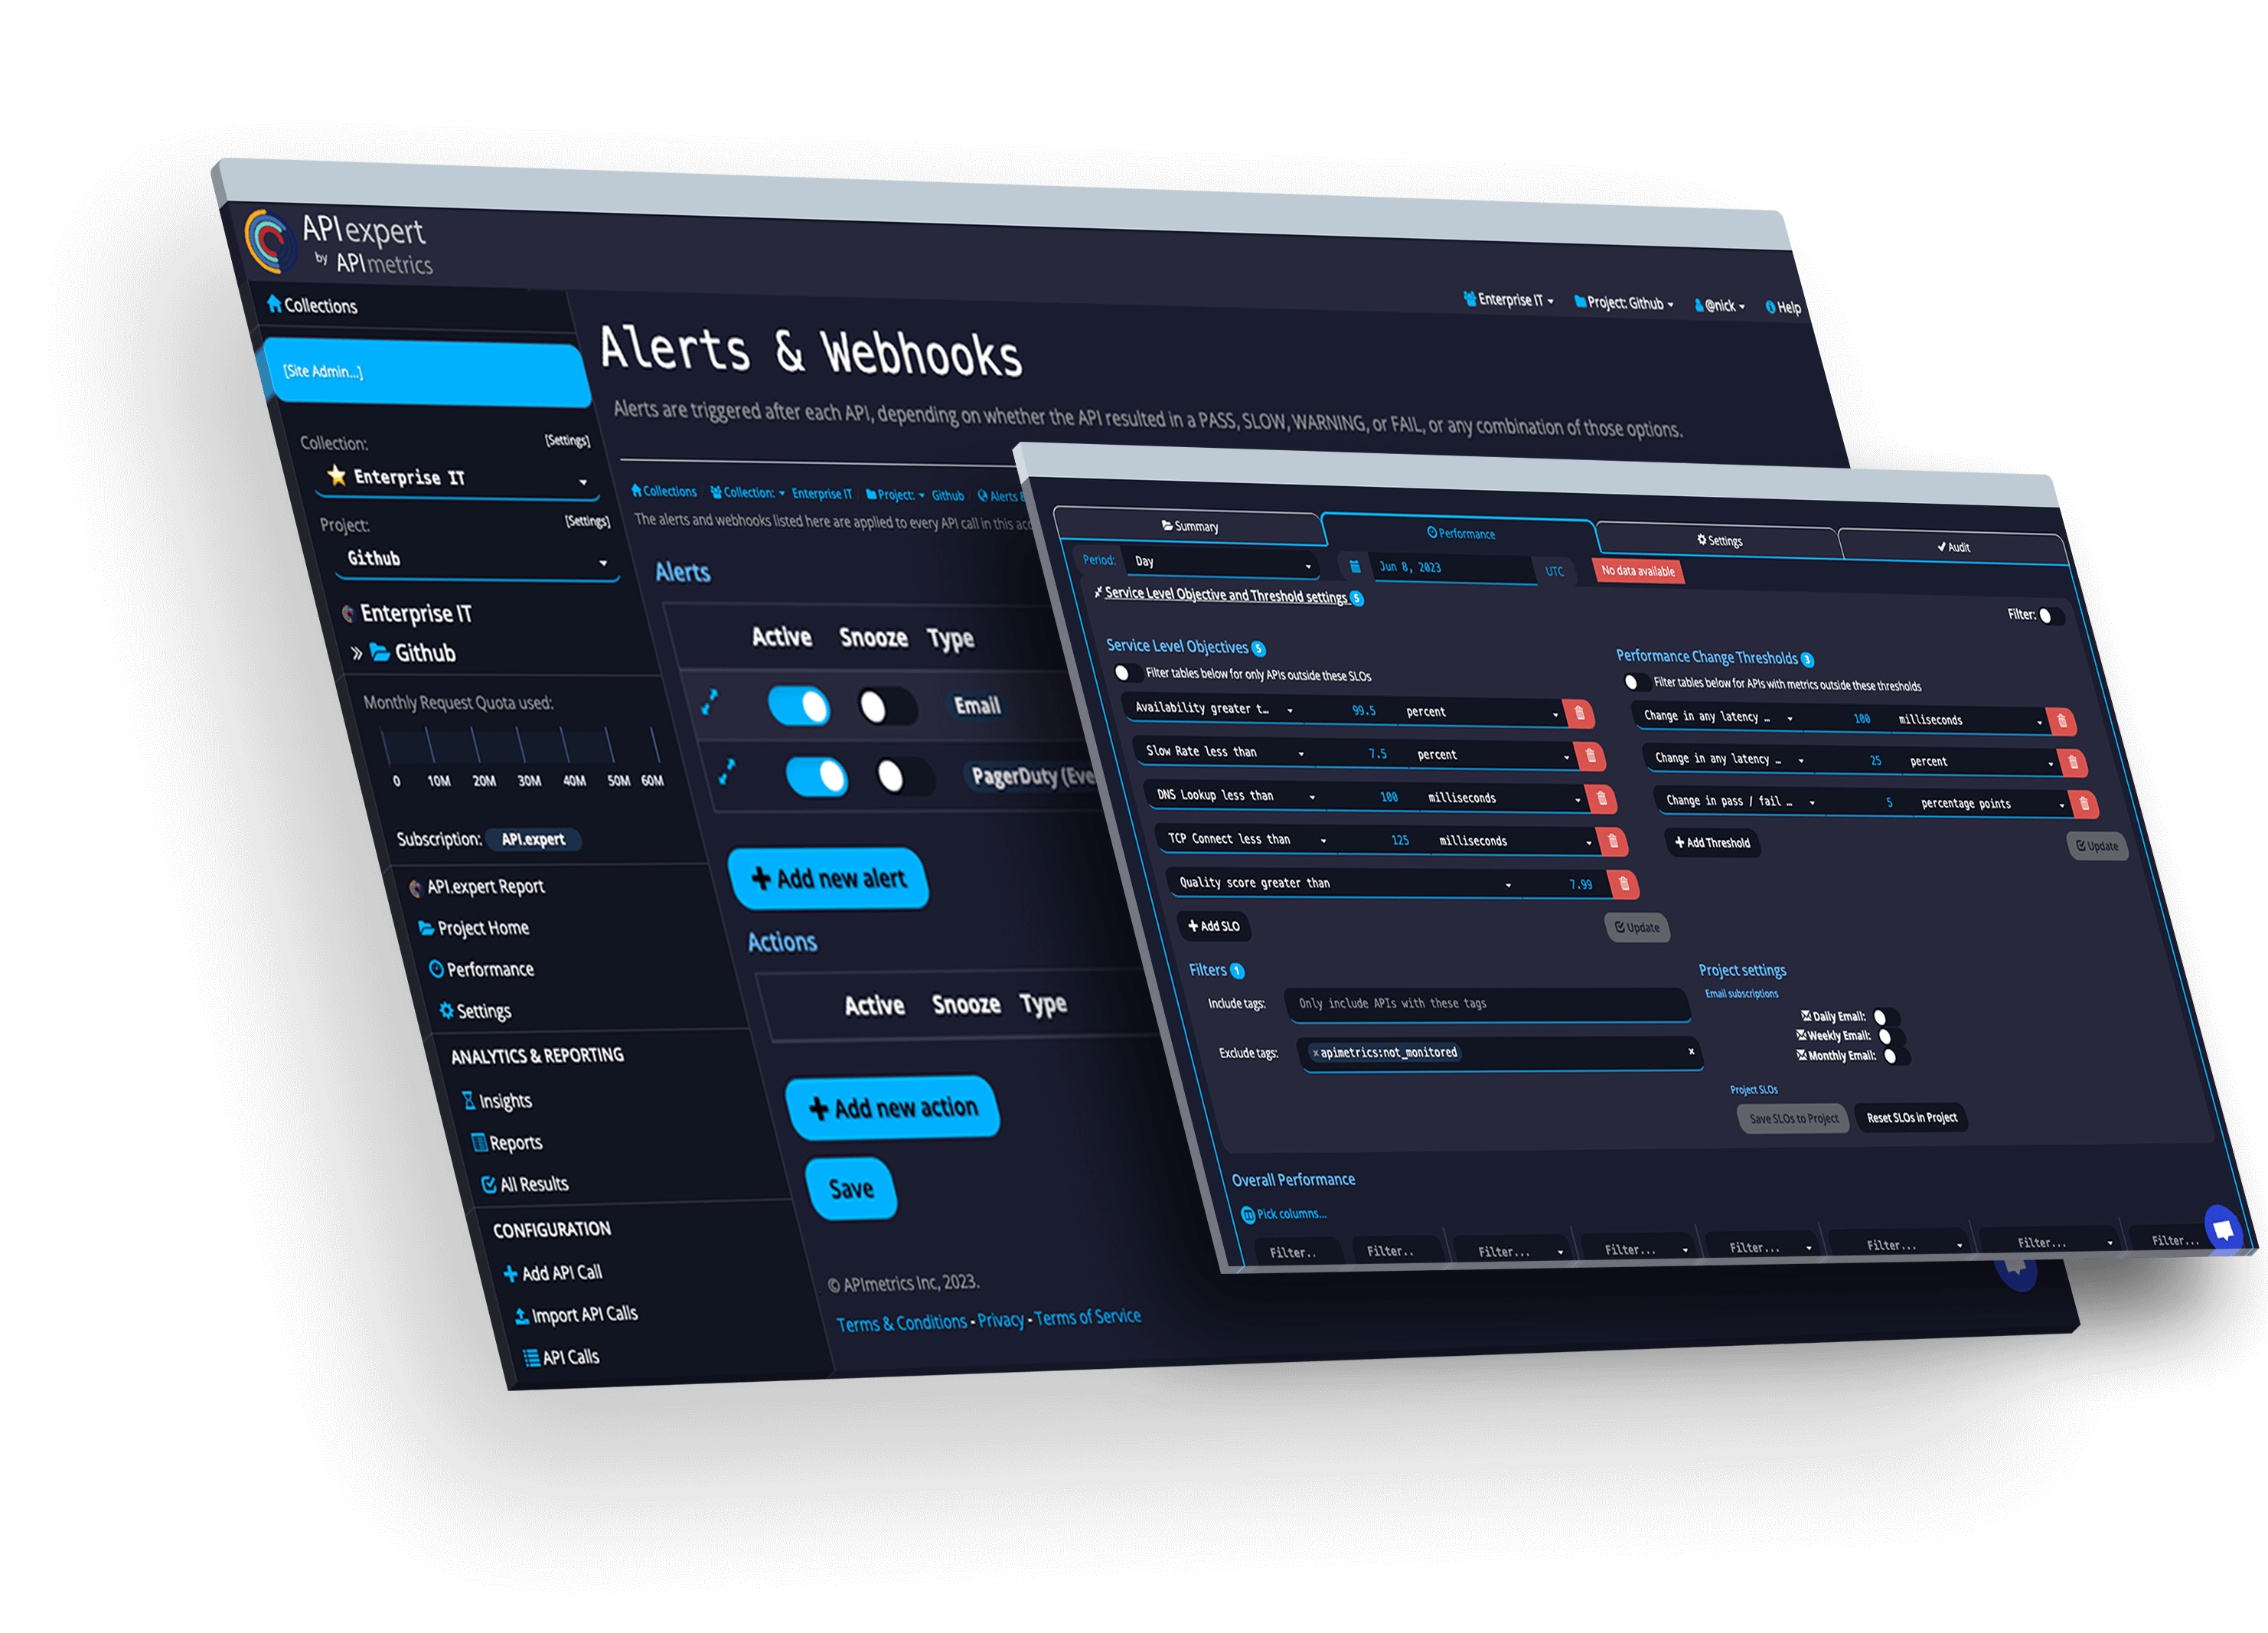
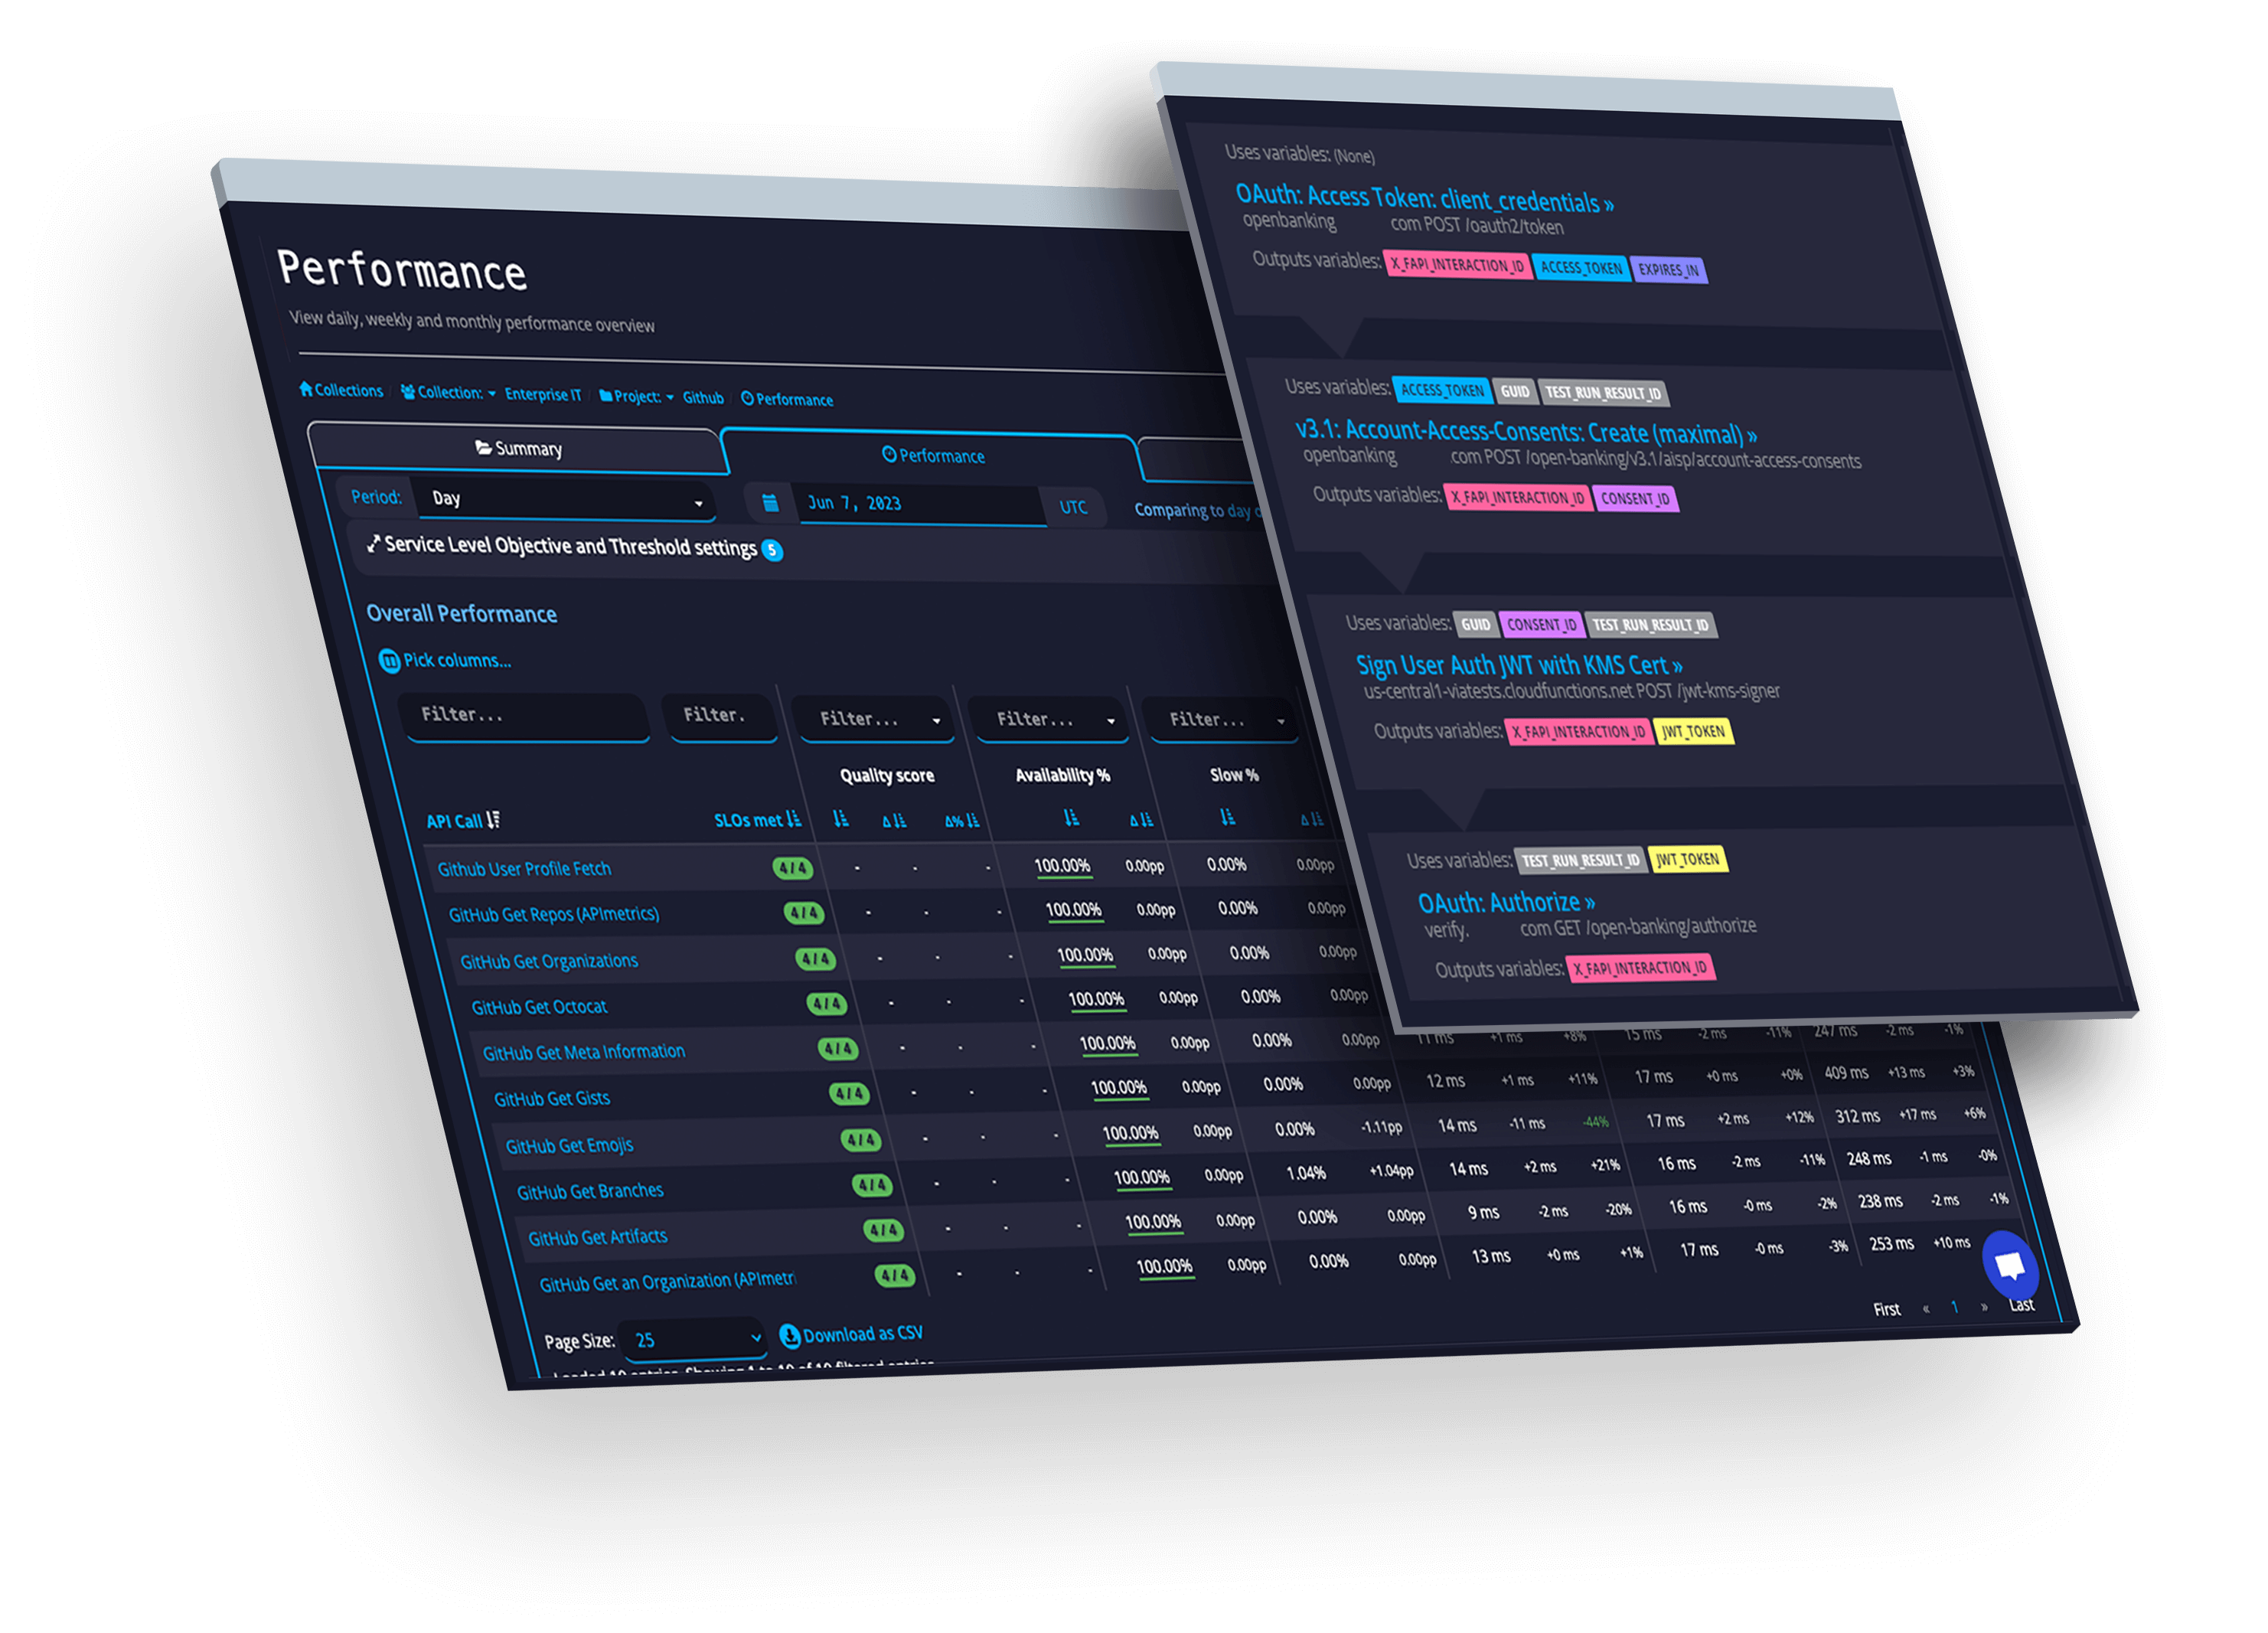
SLAs
Track and manage actionable SLOs & SLAs for the APIs you use and provide.
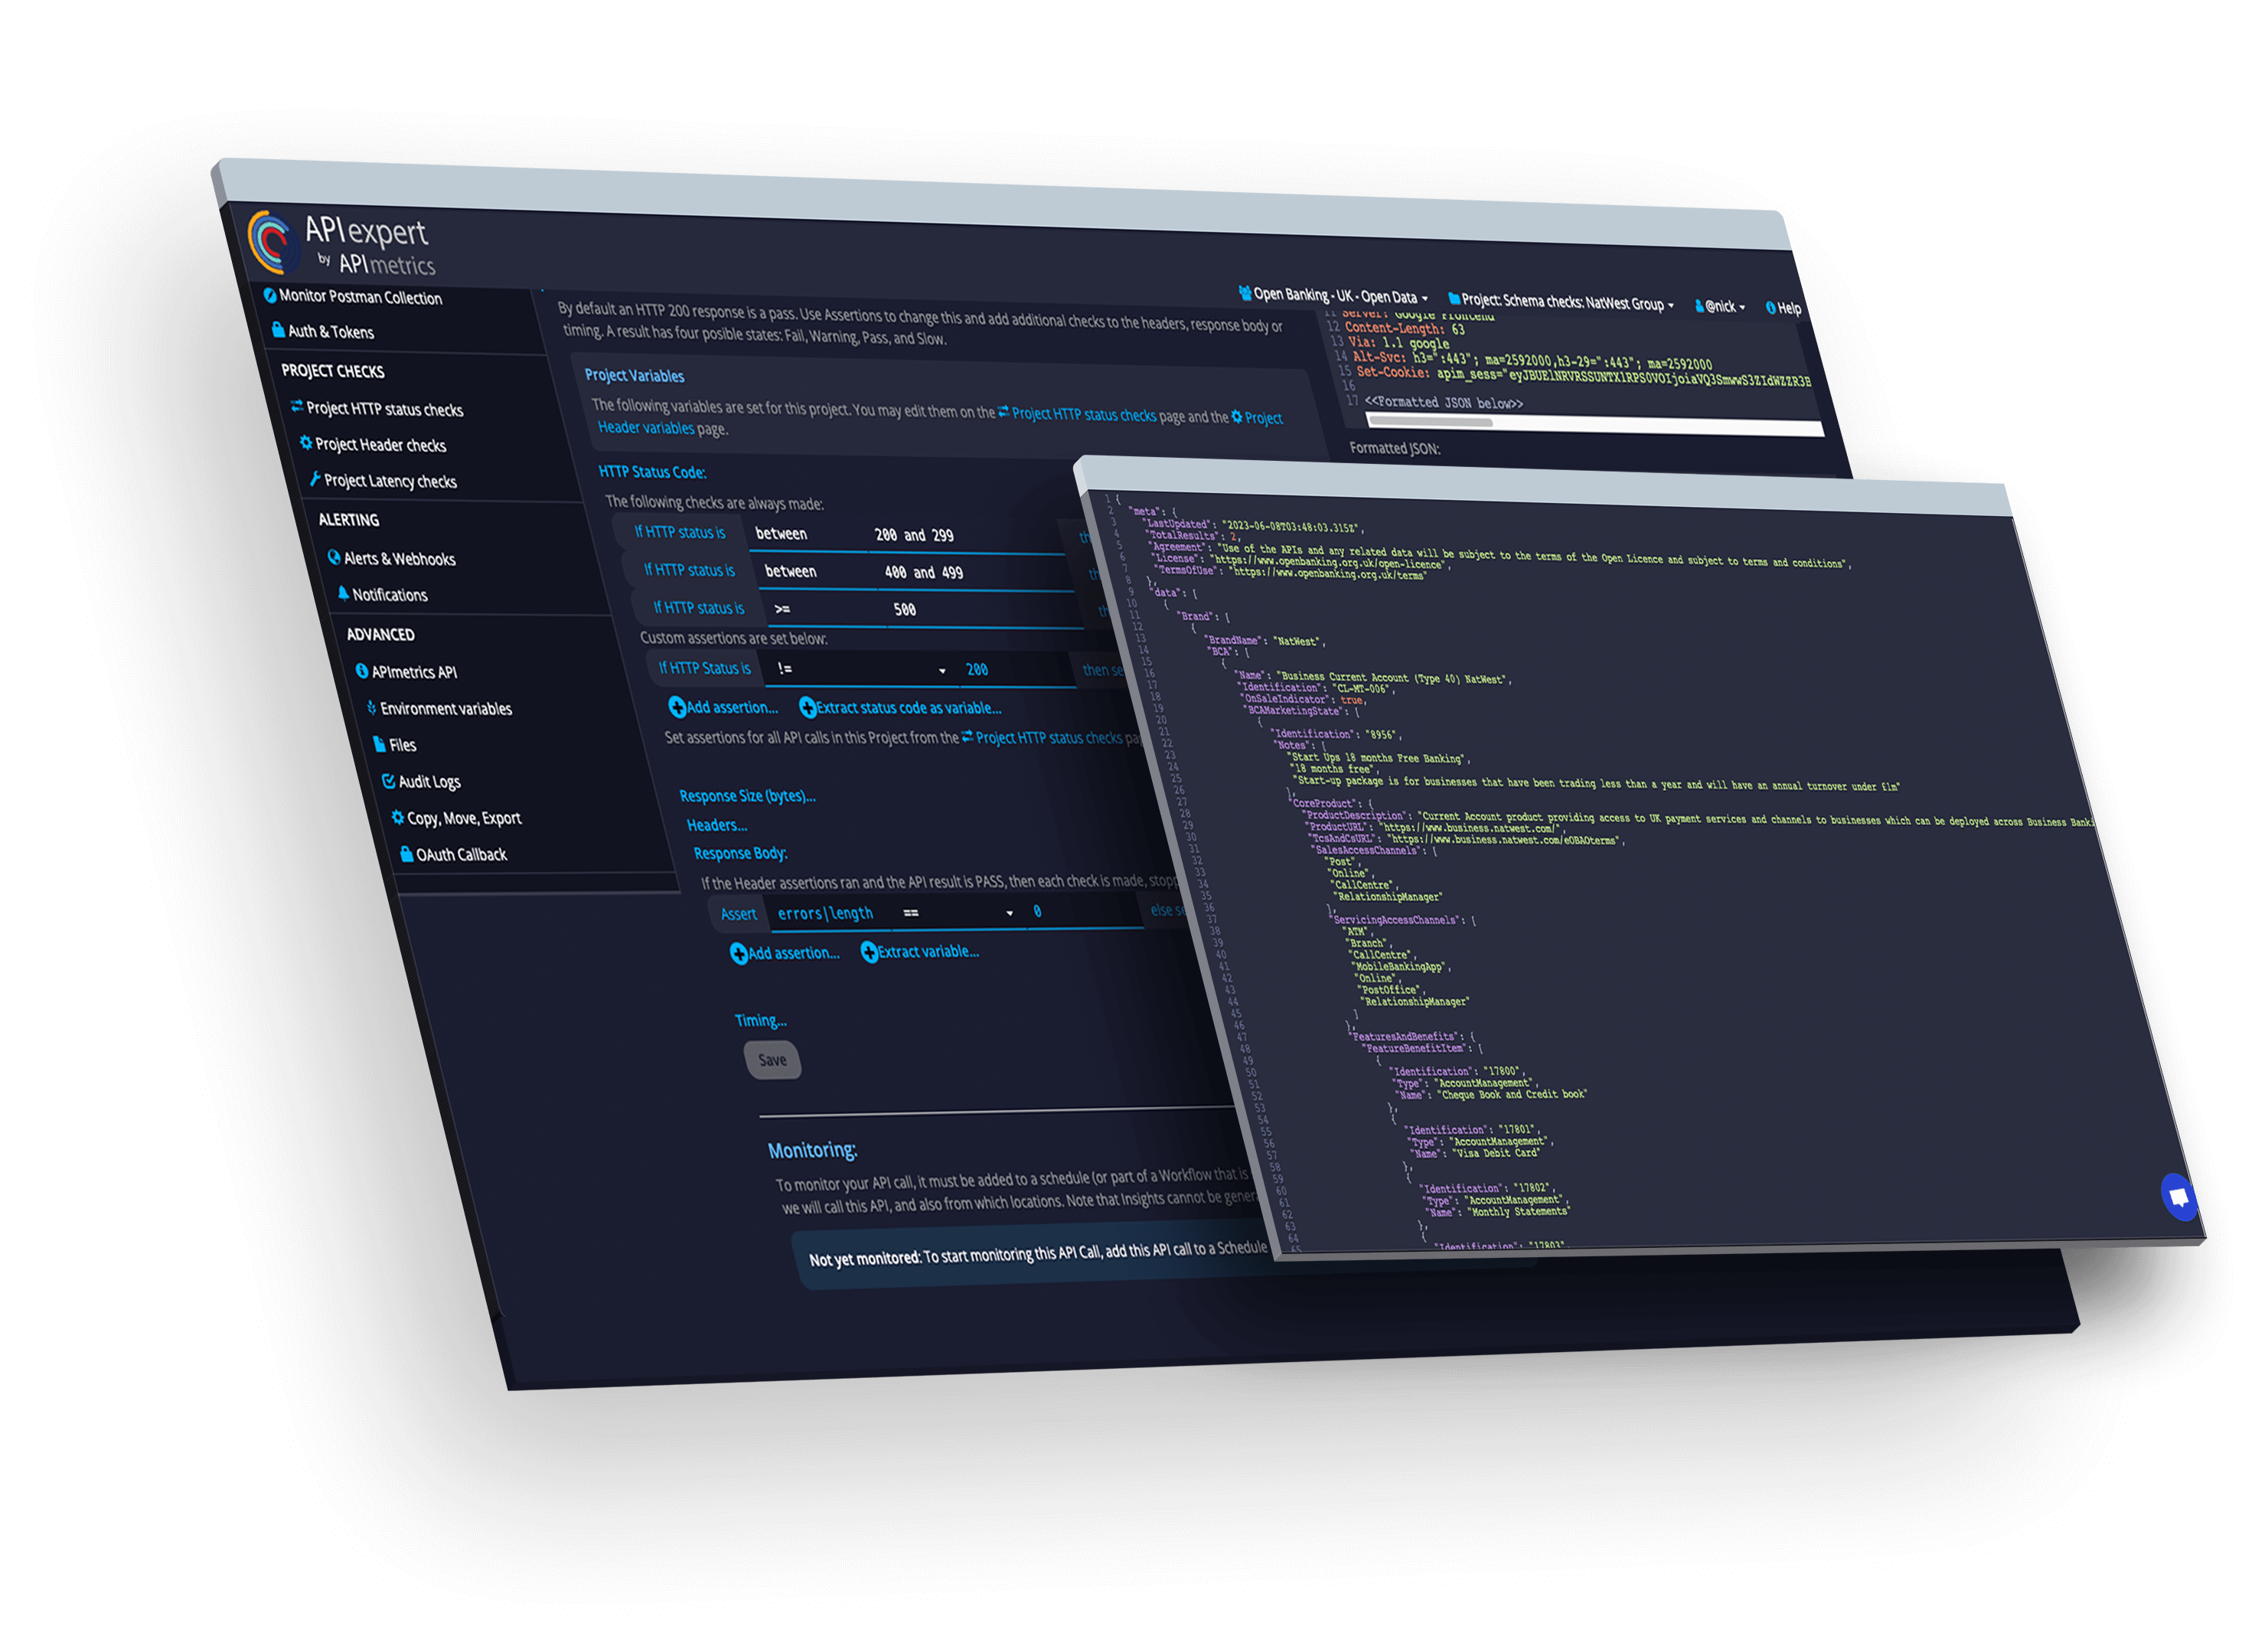
Govern
Validate and verify APIs. Continue to match your designs even in production.
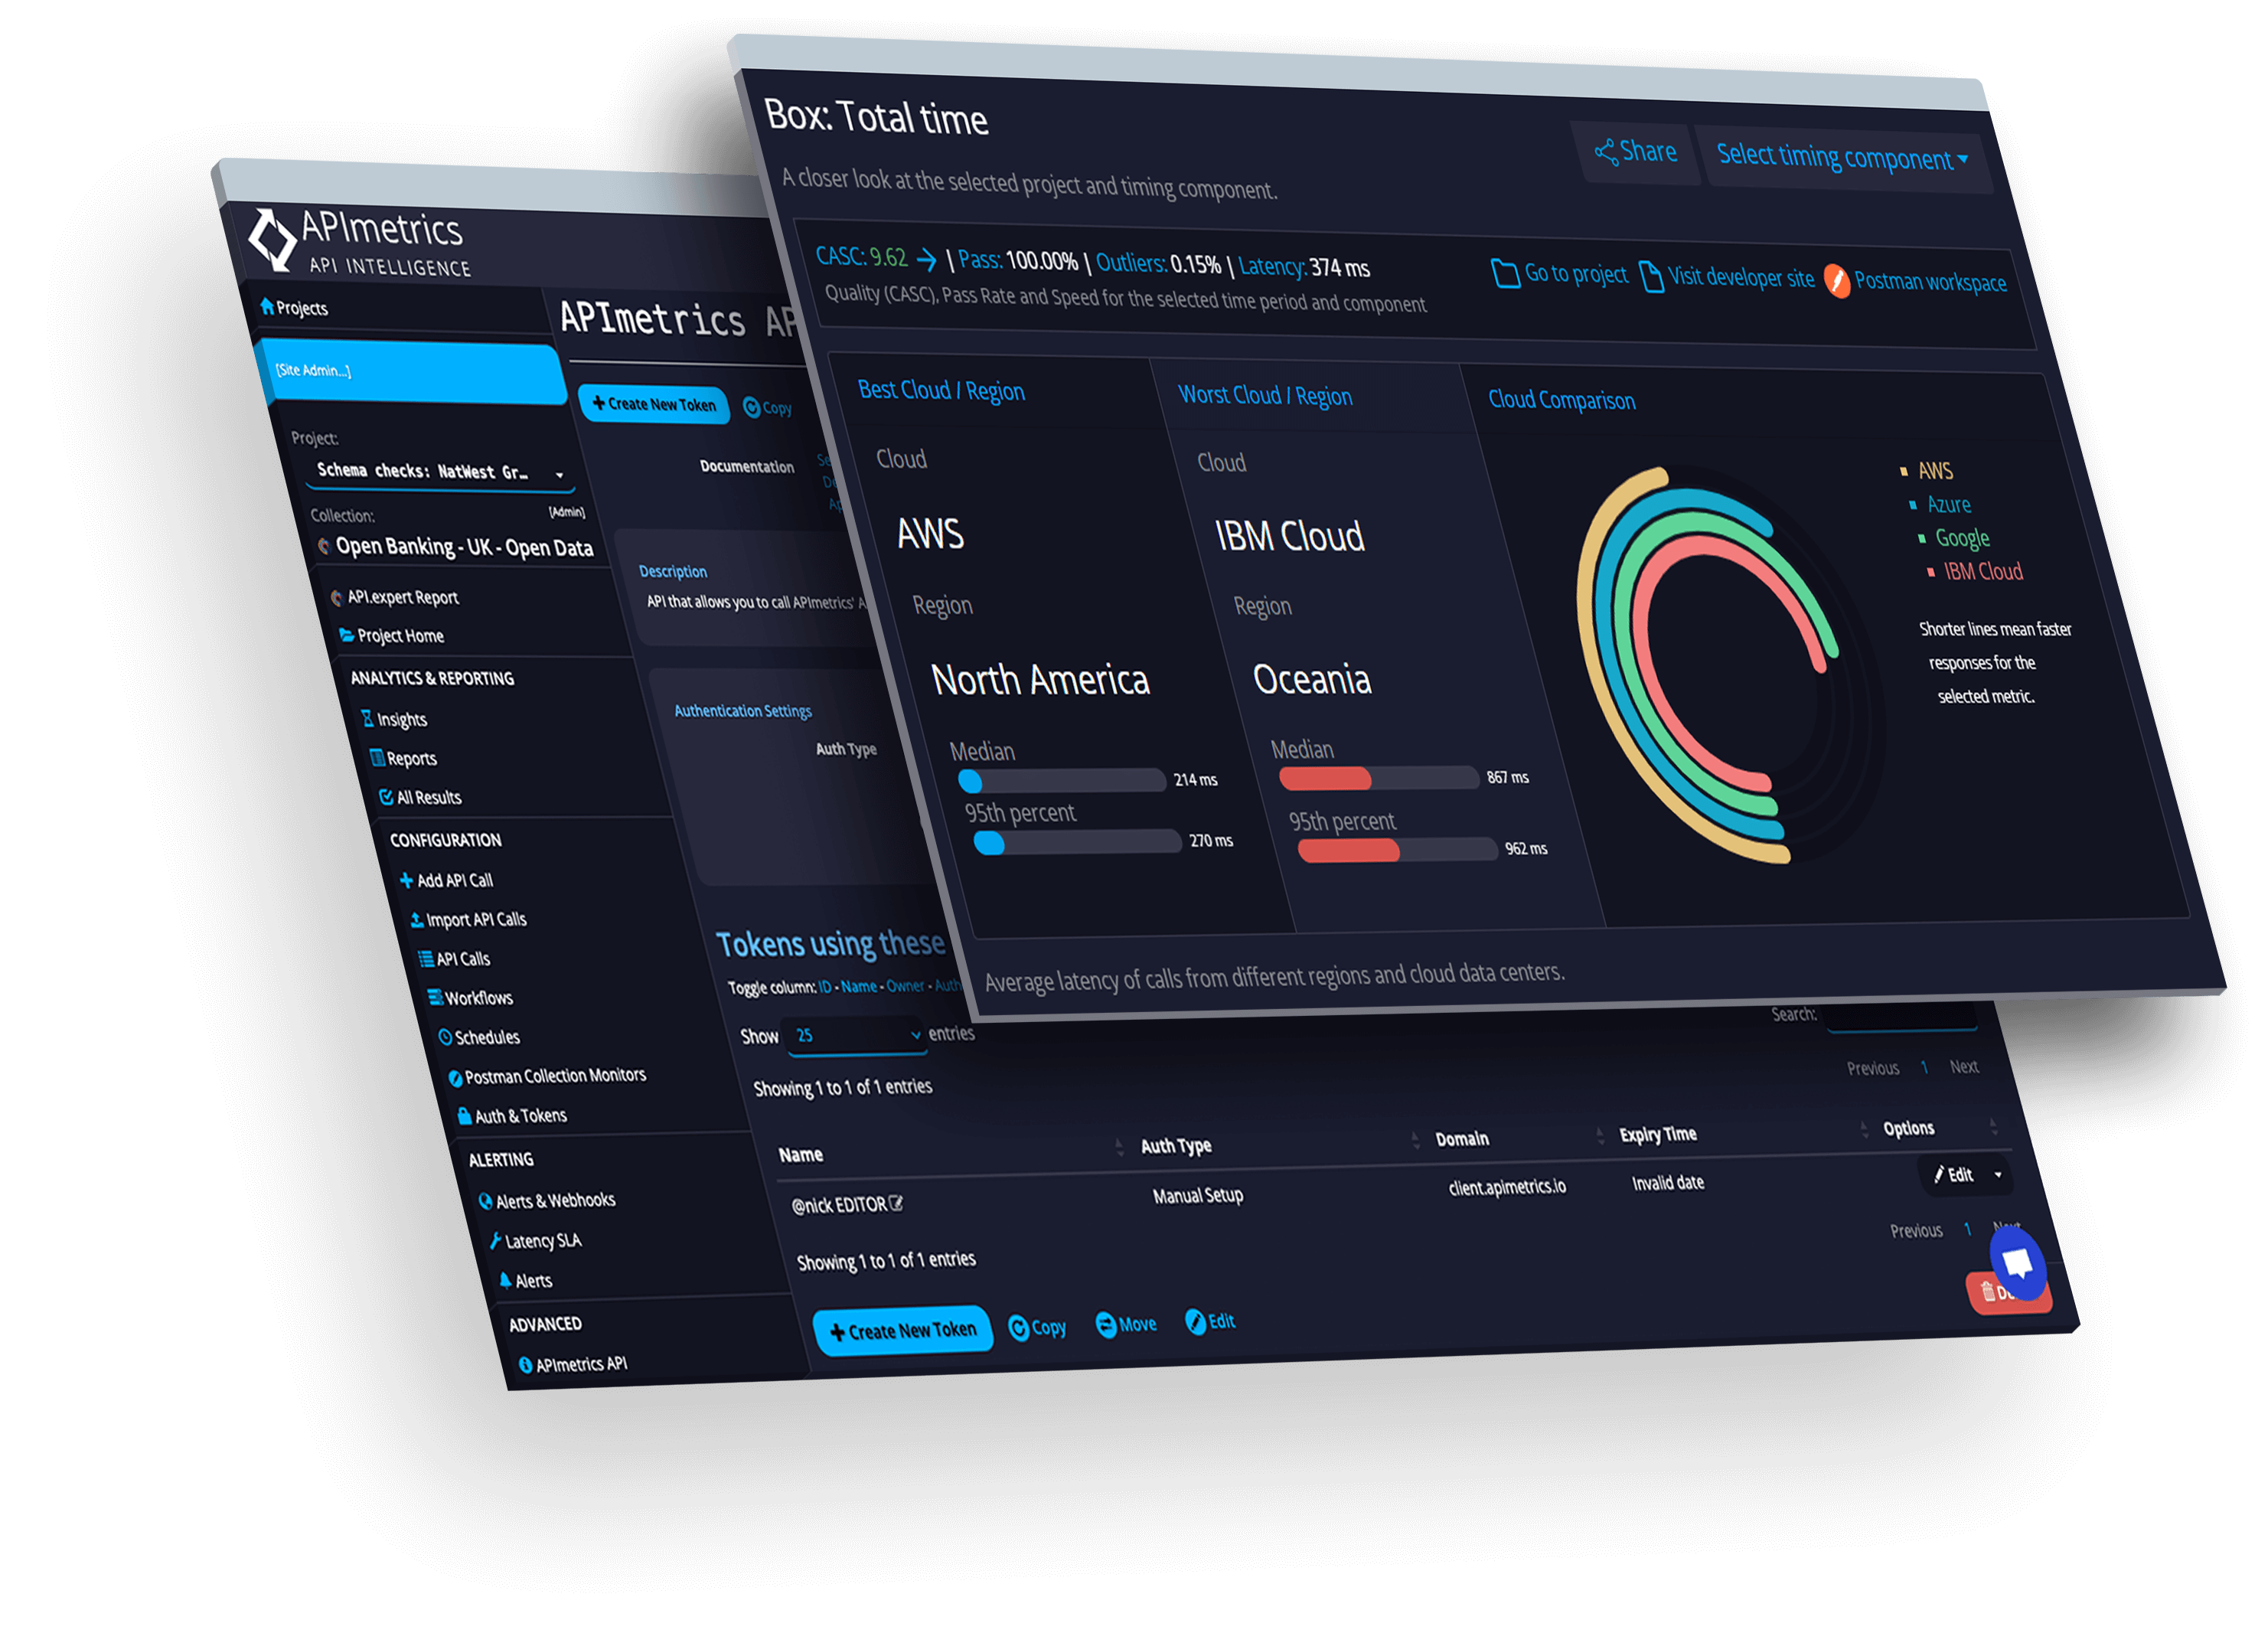
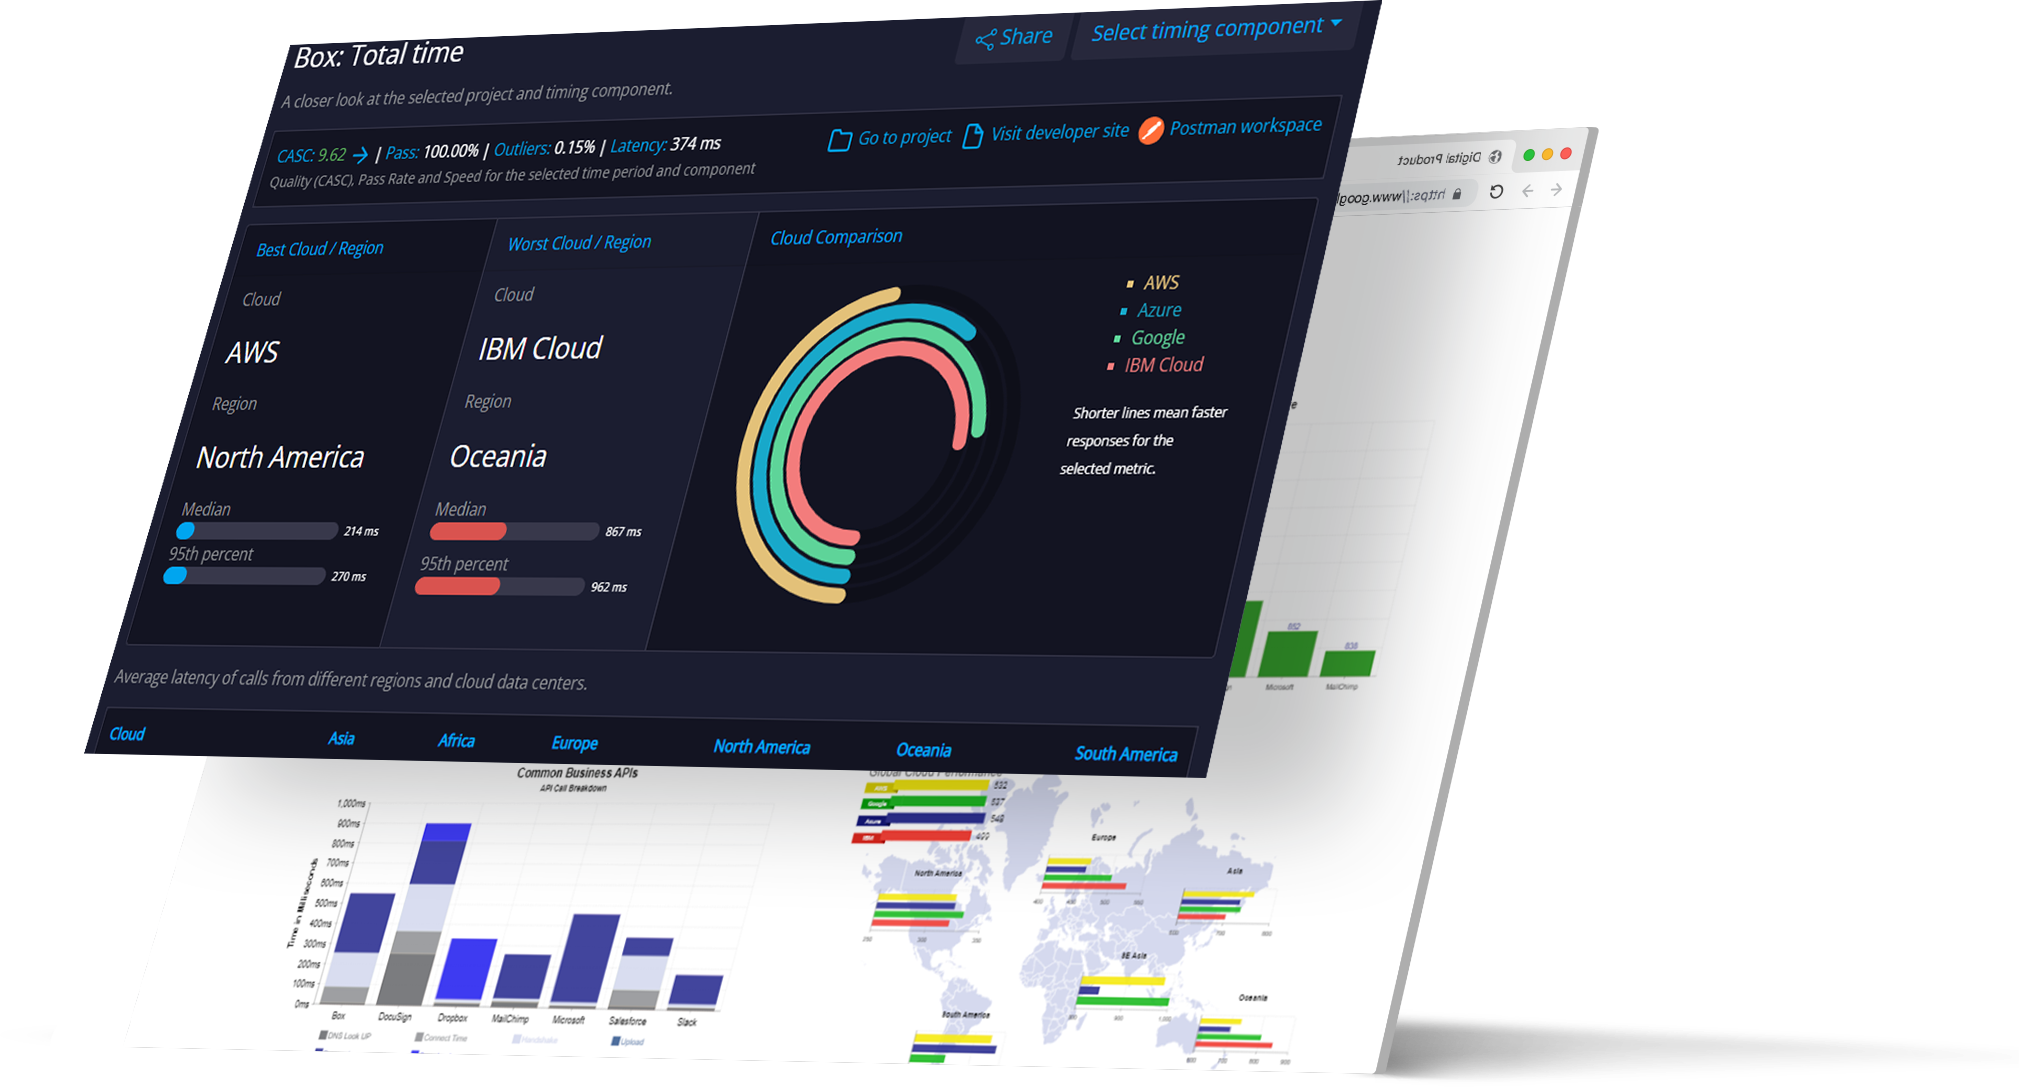
Network
See performance from every cloud in real time.
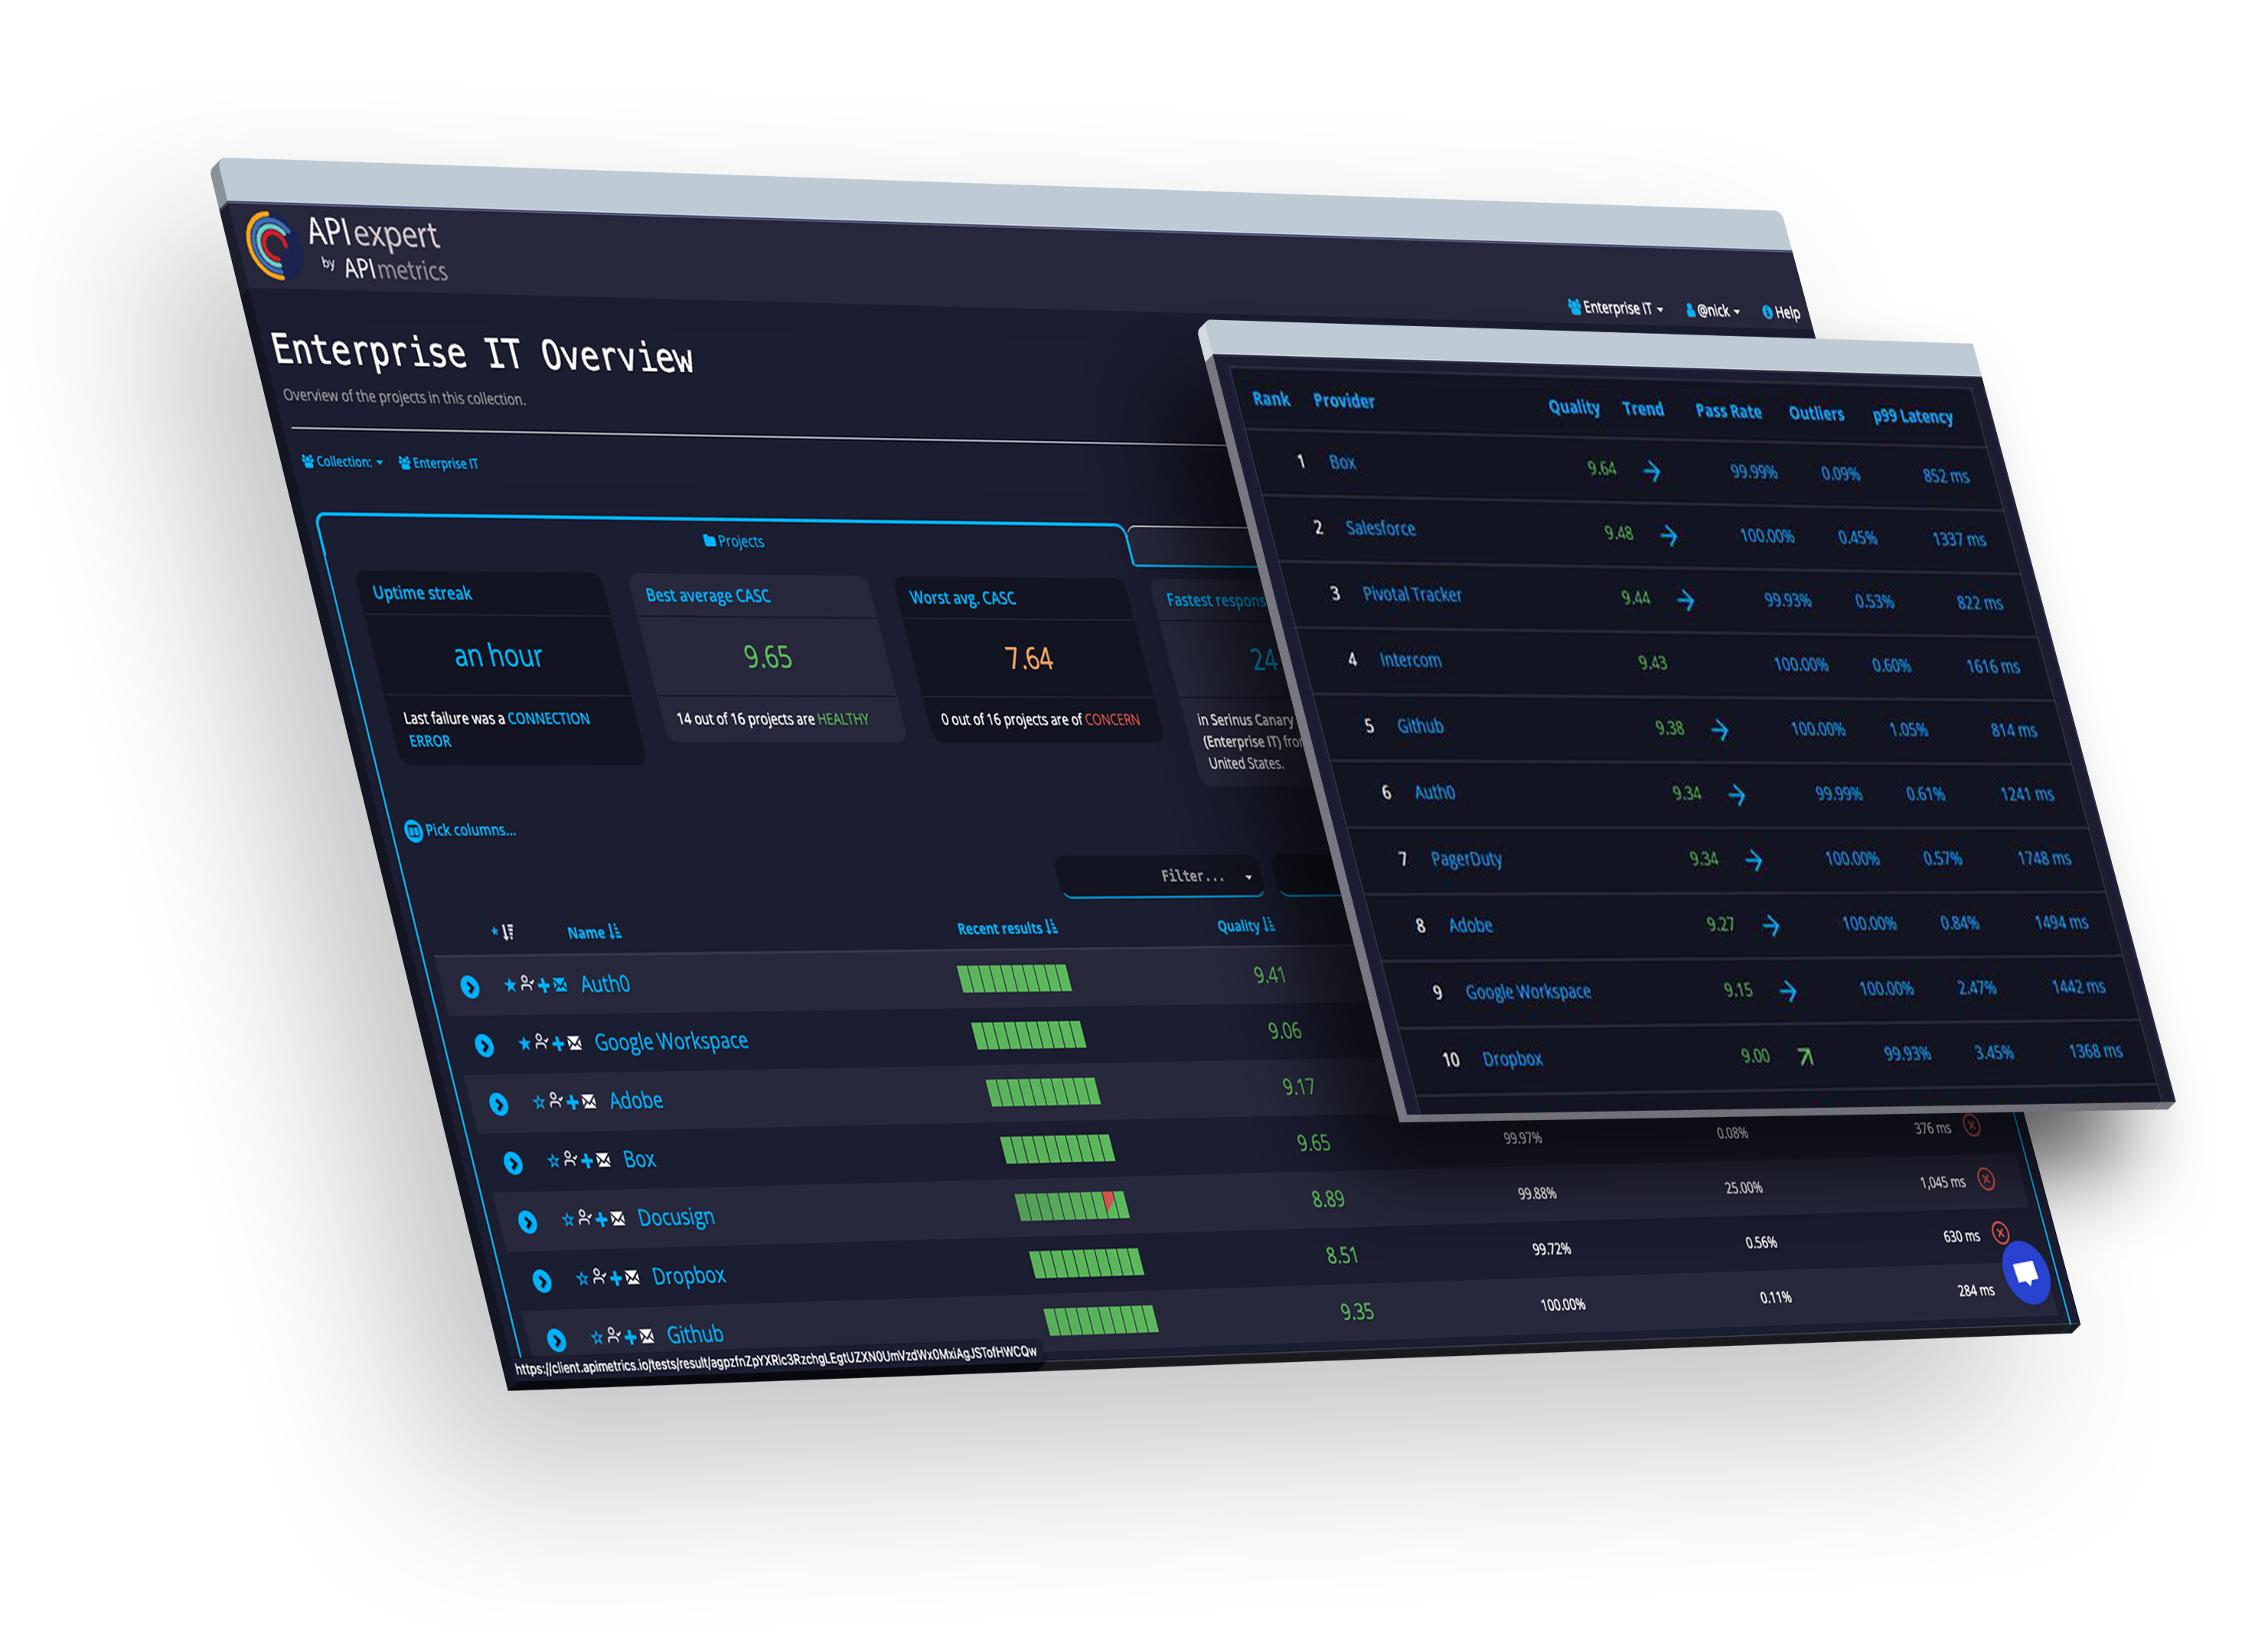
Ratings
Learn how APIs measure up using our patented scoring technologies.


[You] helped us identify significant latency and improve the “lightswitch” experience from more than 7 seconds to 500 milliseconds.

It’s really good … I see everything very quickly on one page and it makes it really easy to go to a problem spot and dig in. Just the other day, we had a single, random incident where one of our APIs flagged a content error, and the whole system made it easy to capture what was needed for the engineers to go do some detailed examination.
Rather than an inside-out view, we realized that we needed a specialized tool that could give us visibility into the performance of our site and apps in the same way that the rest of the internet sees us…
[You] helped us to increase visibility of our APIs performance and significantly improved awareness. It’s great to understand what challenges we would need to deal with once our international footprint increases… we were in a process of finishing up major internal stack optimizations and APIContext really helped to measure/confirm improvements. More improvements are coming and it’s great to have an independent benchmark to compare against.

We were able to monitor the metrics of the API calls, collect them in one place, and then examine the collected data presented in the dashboard to gain insight about our performance. The analysis of the issues and research for possible solutions ... other developers interested in building APIs where duration speed is important would do well to consider APIContext.. to facilitate improvement in performance.
A very successful tool. The alerting and performance monitoring capabilities have given very useful information to our operational teams.