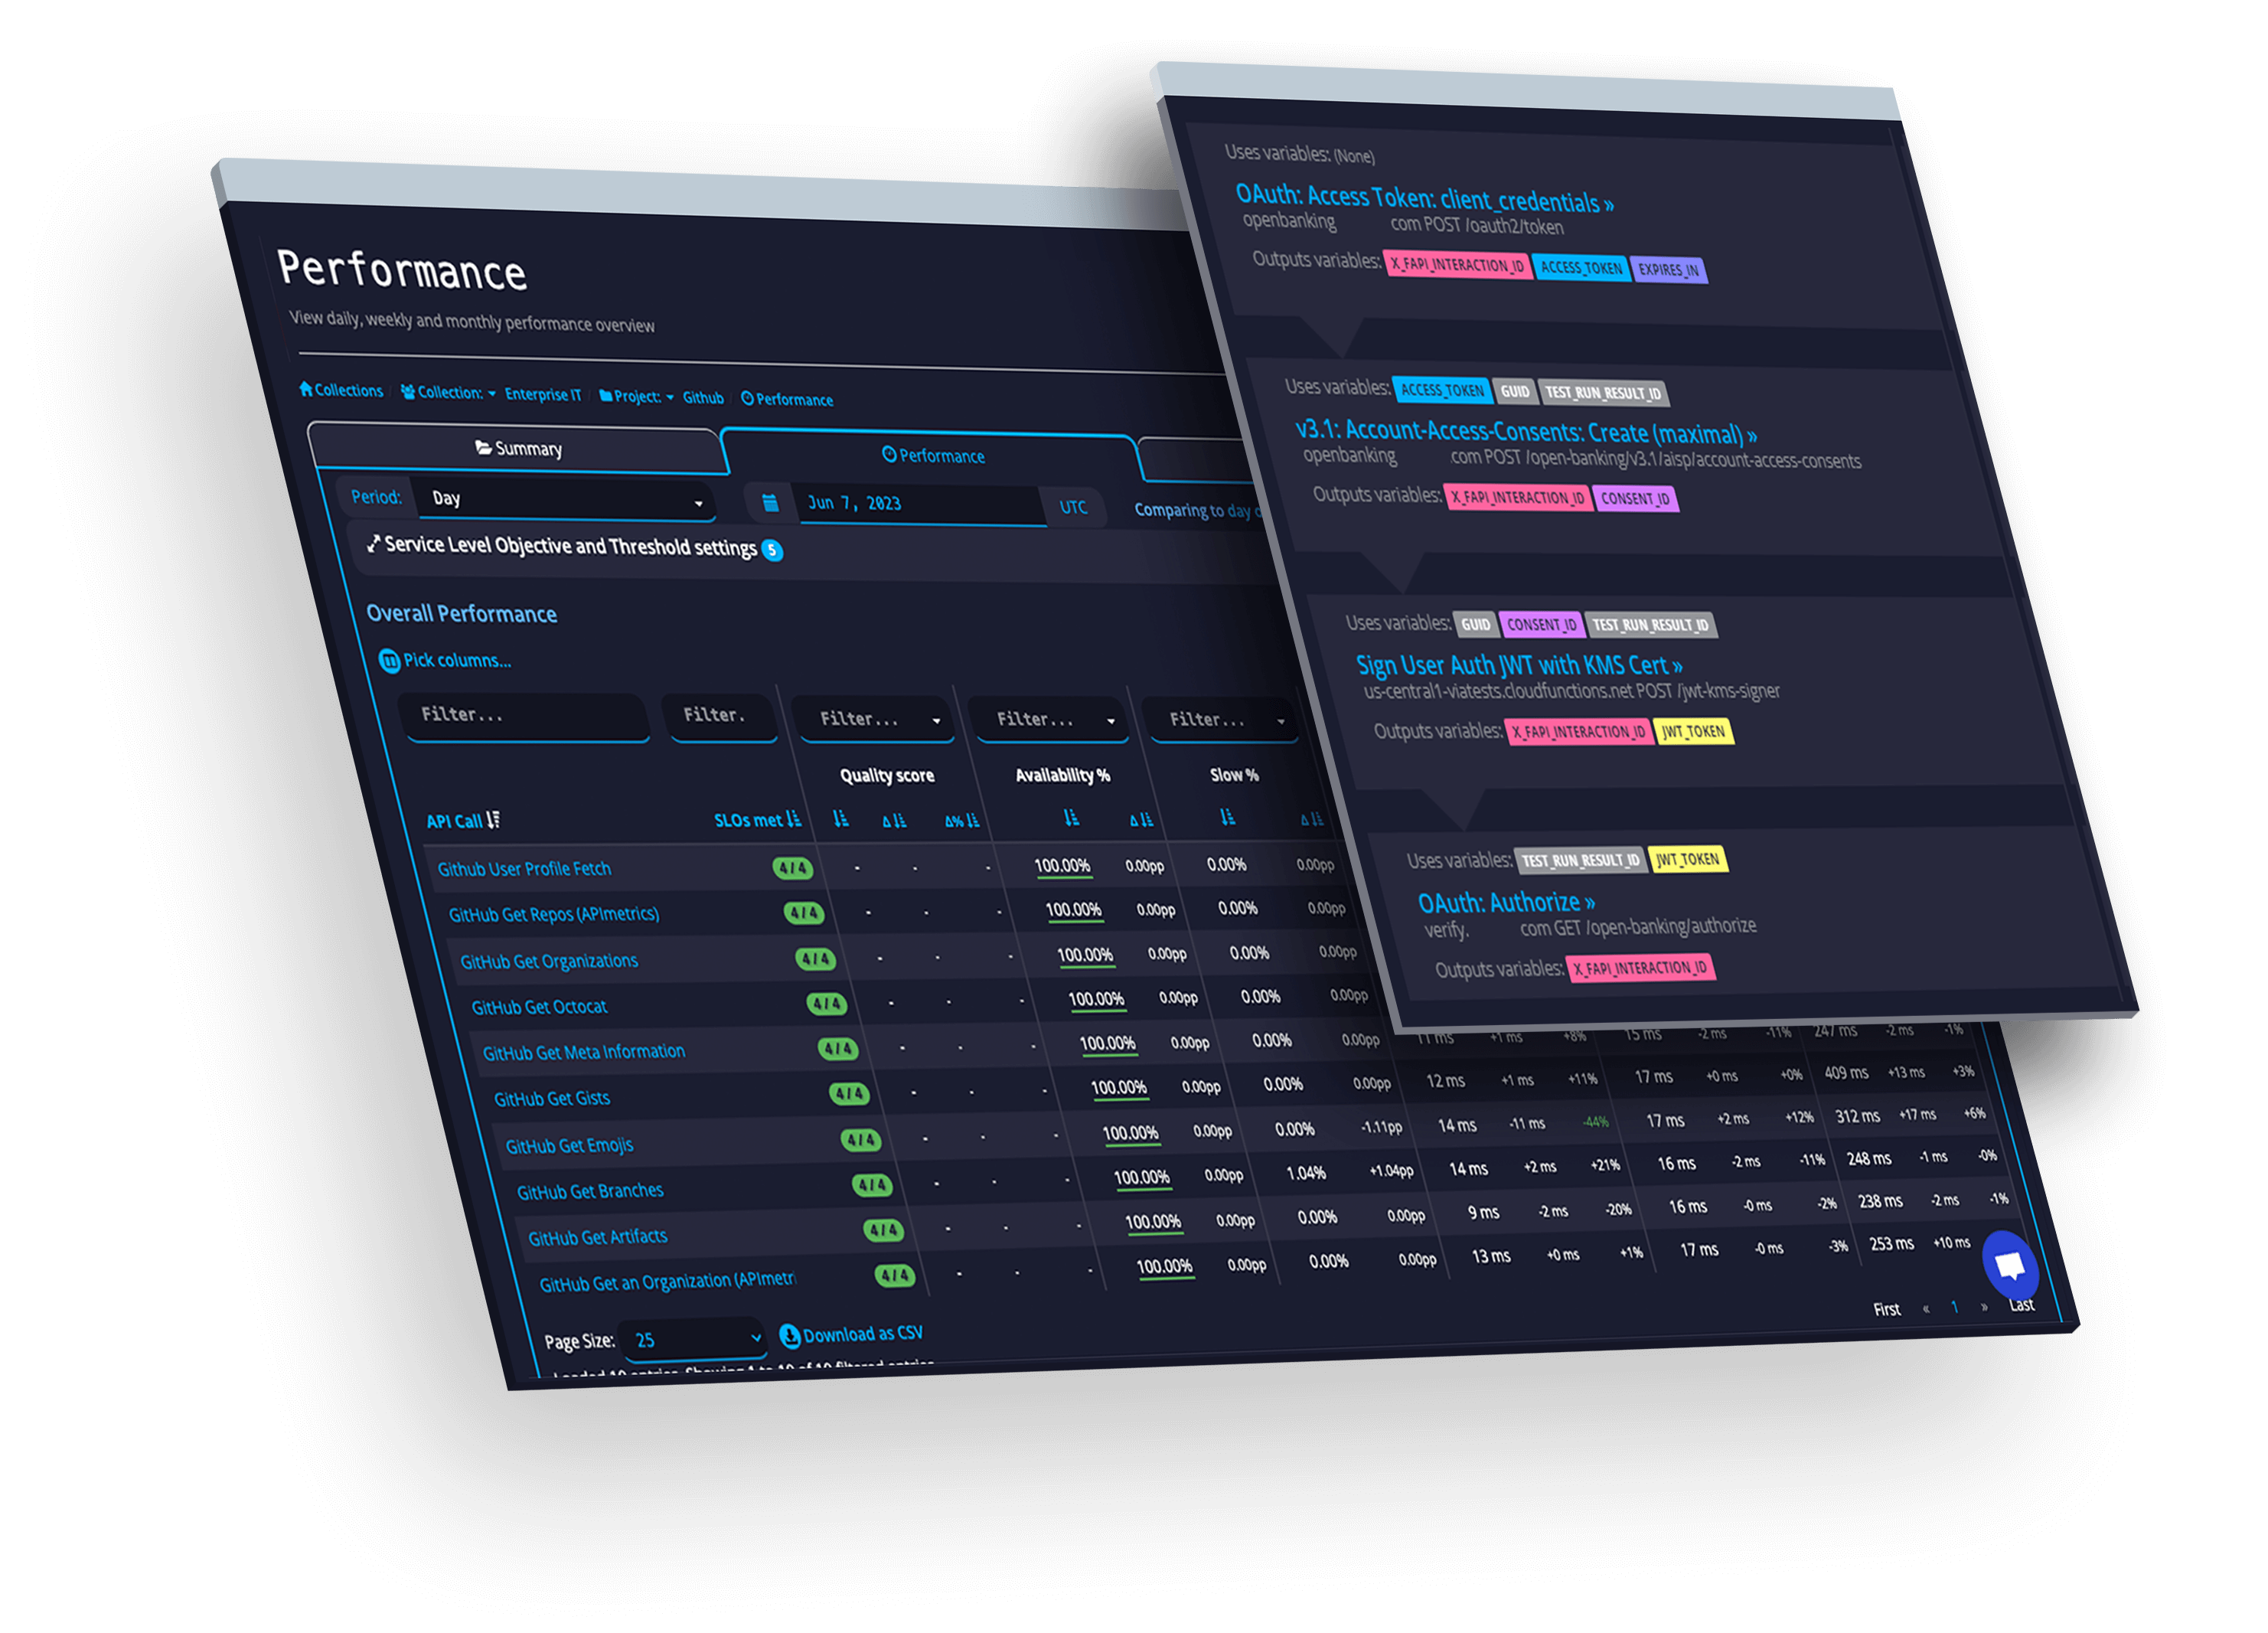
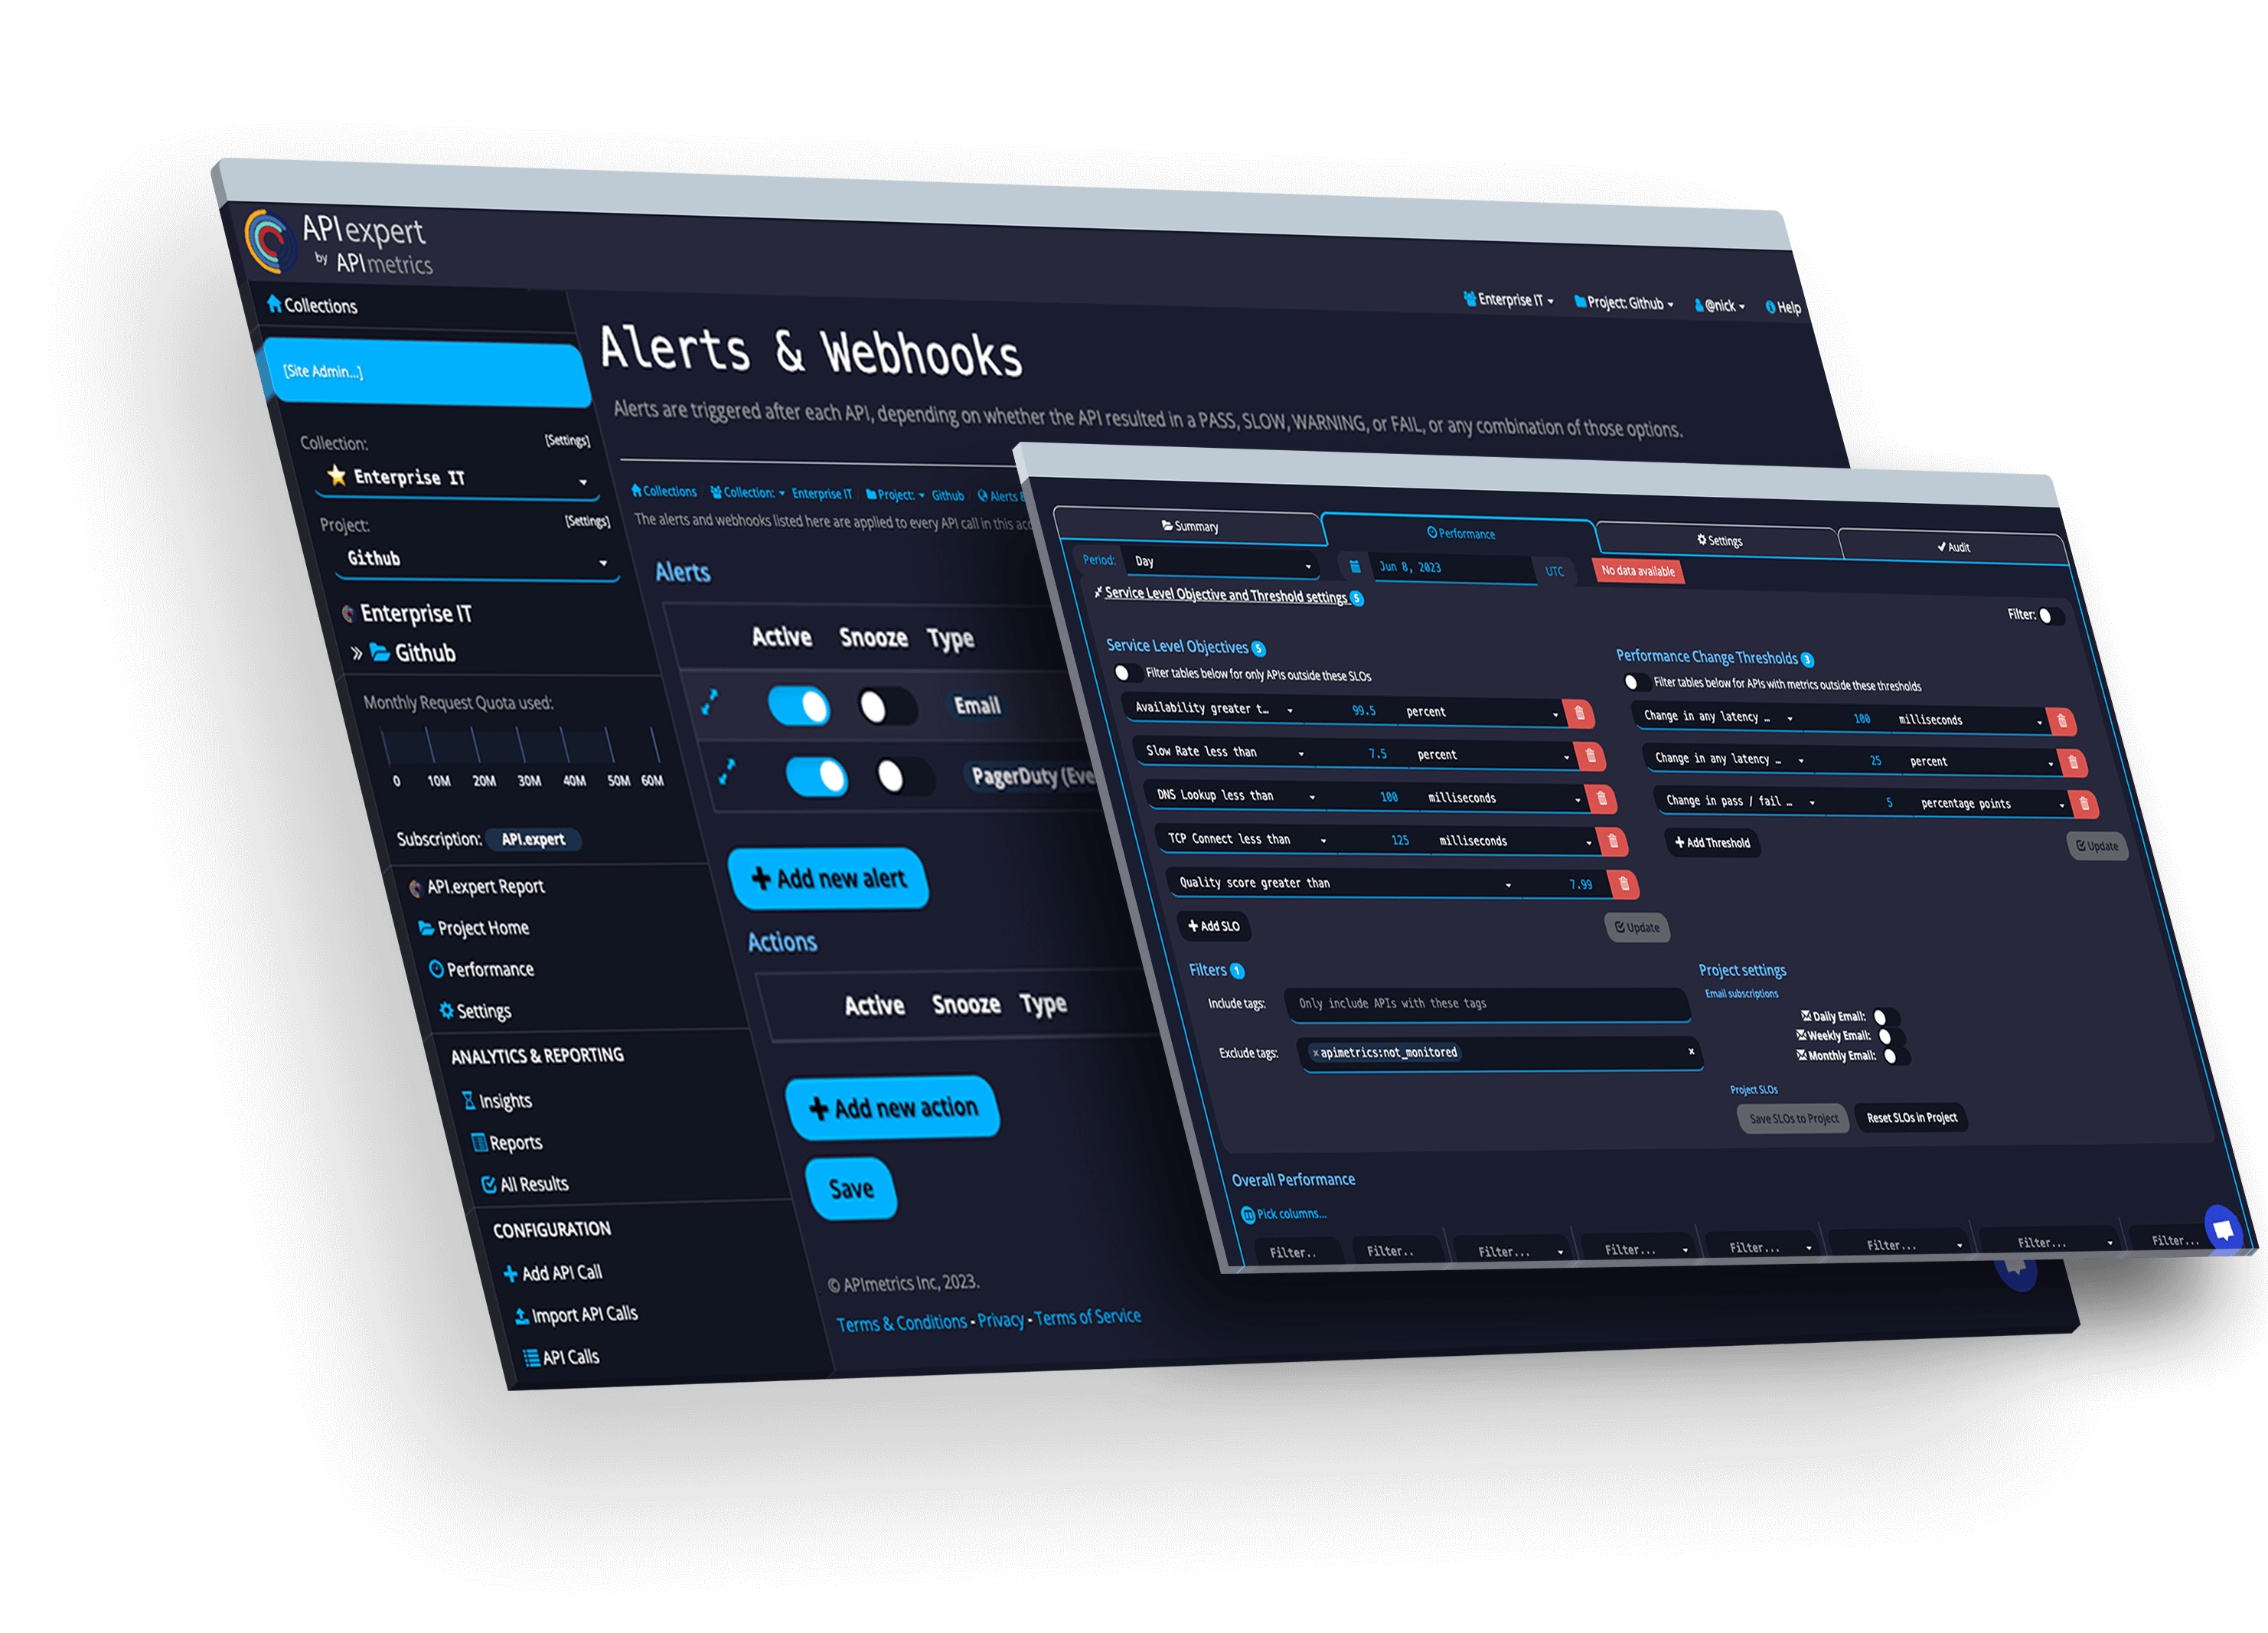
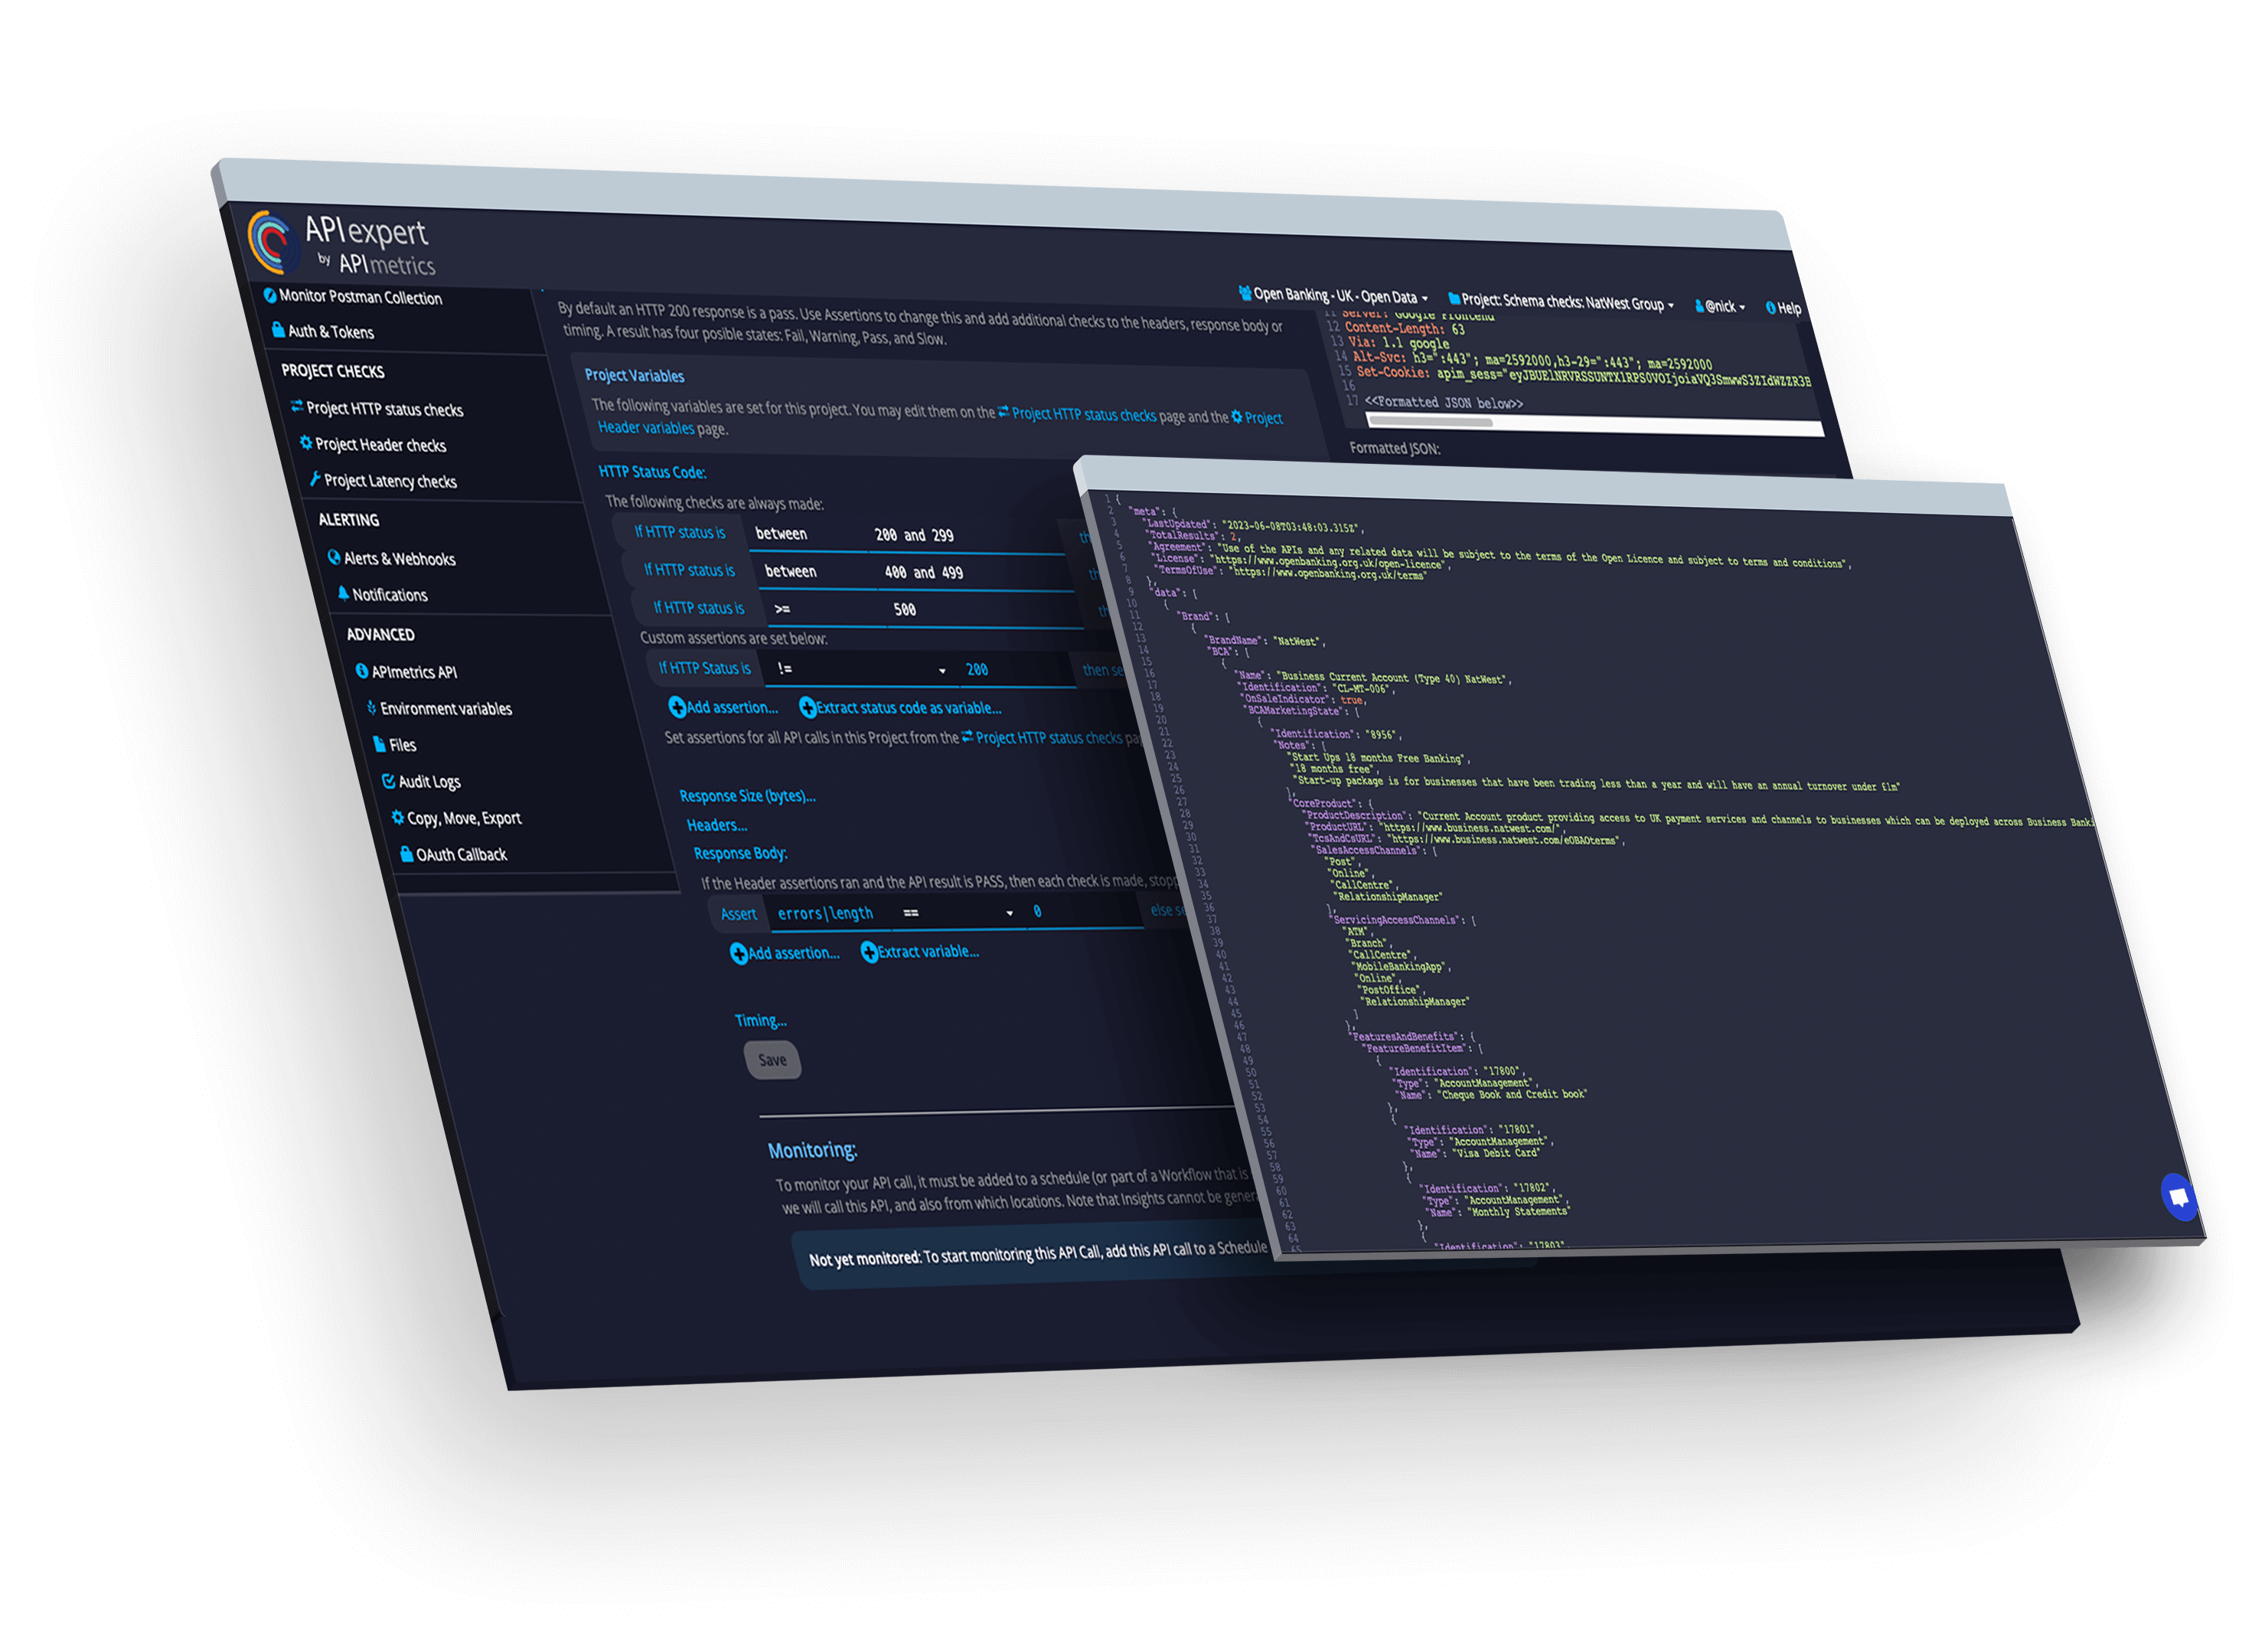
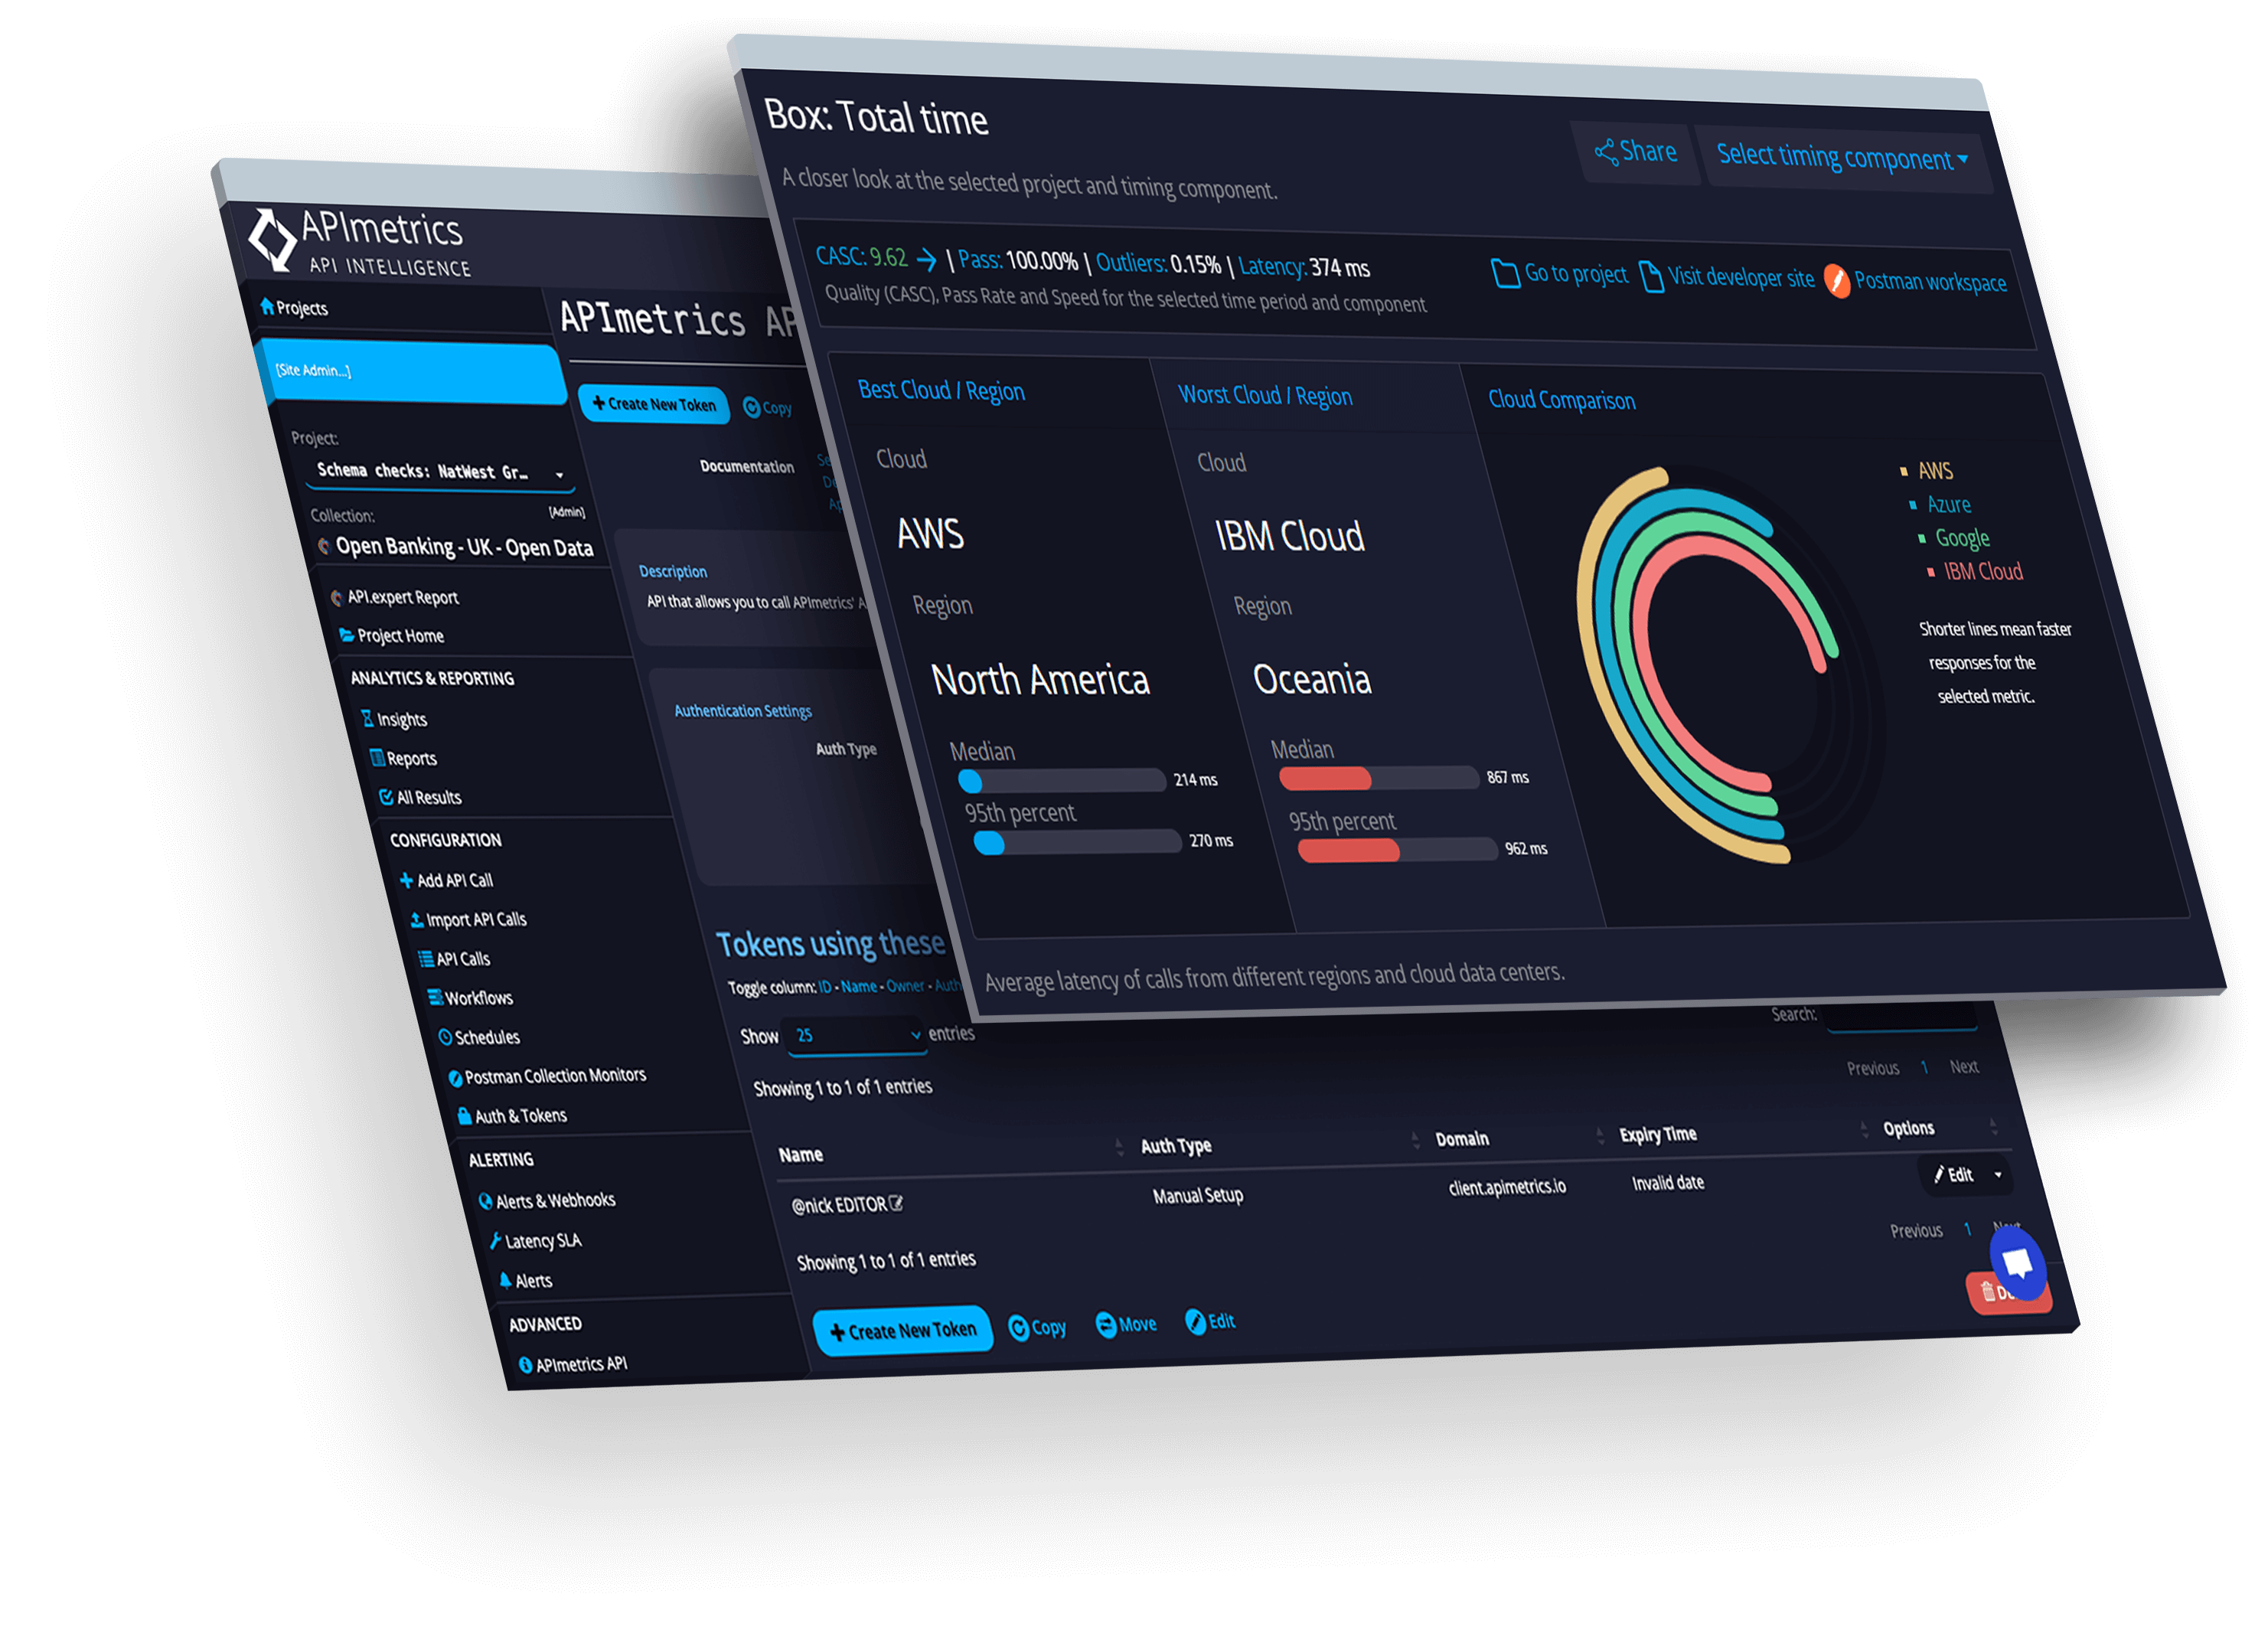
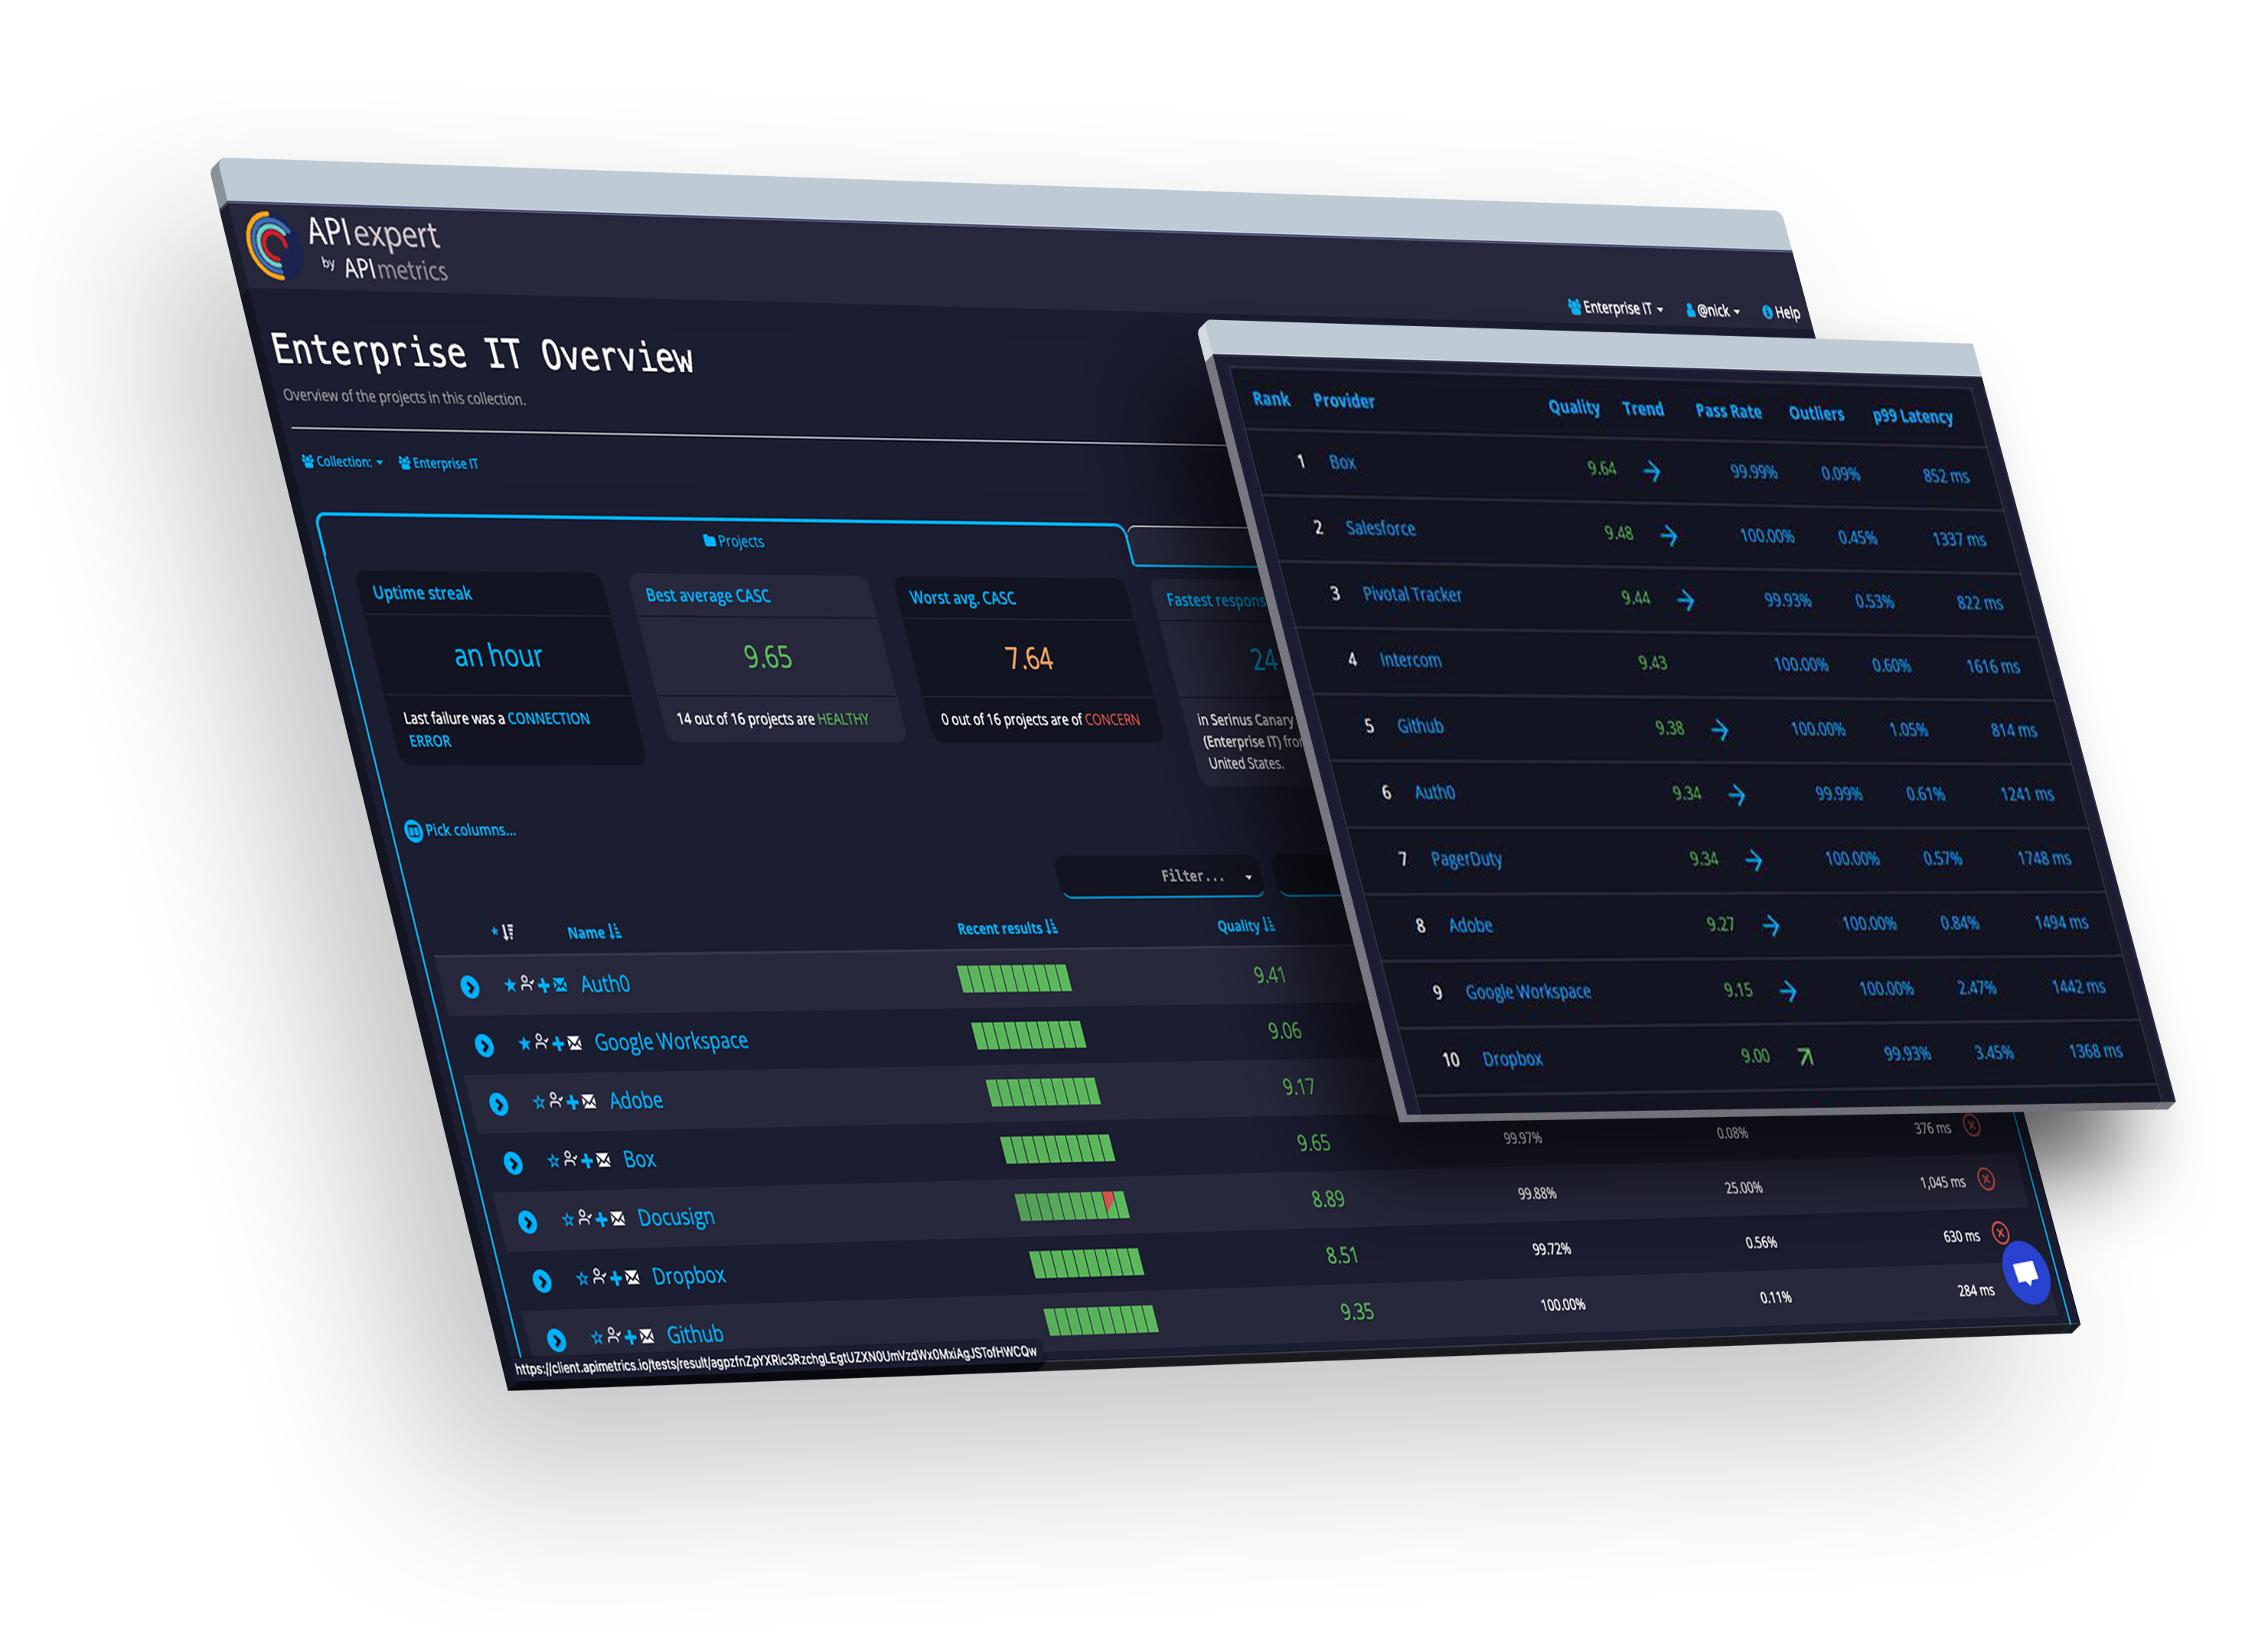
In the past decade API’s have proliferated. Companies sought increased efficiency through automated business-to-business transaction processing using APIs; web-based companies created APIs to enable developers to integrate their data products into new processes; and new companies were created that pulled data from multiple external APIs and fused it into their own processing to produce unique web products that offered potential audiences a view of meshed data that wasn’t available elsewhere. The pandemic accelerated this trend, as people working from home were no longer able to easily and securely connect to the corporate intranet to accomplish their tasks. As the number of available APIs mushroomed, problems arose…
Continue readingAPI Science API
Slack Proves that the Impact of COVID on Technology Professionals Is Permanent
It was major news when Slack experienced a global outage on January 4, 2021, the first work day of the new year. The Associated Press article Slack kicks off 2021 with a global outage reported: “It’s the latest tech glitch to show how disruptive technical difficulties can be when millions of people are depending on […]
Continue readingWhy Does Tail Latency Matter?
It’s a complicated question, actually: latency versus throughput. Throughput is how many responses you can give to your varied customers in a certain amount of time. Latency is the amount of time it took for an individual customer to receive the response to their request. If your product is going to succeed, obviously you need […]
Continue readingThe Effect of Global Location on CURL Call Metric Patterns
My previous post used CURL component metrics to illustrate performance in calling the World Bank Countries API (located in Washington, D.C.) from Oregon. The curl resolve, connect, processing, and transfer times for calls from Oregon over a period of one week were plotted and analyzed. Here is the plotted Oregon data: The conclusion from studying […]
Continue readingUsing CURL Component Data to Illustrate API Call Performance Patterns
My last post analyzed performance component results produced by the curl Internet data transfer utility in an effort to understand what typically causes slow API call performance. Four instances of unusually slow but successful calls to the World Bank Countries API were studied. In three instances (calls from Oregon, Ireland, and Japan), curl’s Processing Time […]
Continue readingAnalyzing the Causes of Slow API Call Performance
In recent posts I’ve been analyzing the data for a week of API monitoring from four different locations around the globe (Washington, DC, Oregon, Ireland, and Japan). The hourly performance for calls over the week looks like this: Since the World Bank Countries API that’s being called is located in Washington, DC, it’s not surprising […]
Continue readingAnalyzing API Performance Hour-of-Day Statistics
A recent post analyzed API performance by hour of day over a one-week period. The average performance of calls to the API was fairly consistent, except for calls made in the last hour of the day (the hour before Midnight Universal Time). This plot presents the analysis results: The question is: why was average performance […]
Continue readingAnalyzing API Performance by Day of Week
My last post showed how the API Science API can be utilized to create a graphical analysis of API performance binned by hour of day. In this post, we use data extracted from the API Science API to analyze the performance of an API by day of week. This type of analysis would be useful […]
Continue readingAnalyzing API Performance Binned by Hour of Day
Performance data from the API Science API can be analyzed in many different ways. For example, a recent post presents A Graphical View of API Performance Based on Call Location. The analysis uses cURL statistics to compare the performance of monitors that call the World Bank Countries API from various locations around the globe over […]
Continue readingAnalyzing API Call Performance from Different Global Locations Based on cURL Metrics
My previous post presented “A Graphical View of API Performance Based on Call Location.” In that post, we analyzed the performance of a week of calls to the World Bank Countries API (which is served from Washington DC) from four different locations around the globe: Washington DC USA, Oregon USA, Ireland, and Tokyo Japan. The […]
Continue reading