API Monitoring & Governance
Measure real-world, end-to-end API performance & meaningful API quality. Set and track SLAs. Validate security. Verify content & check for data leaks.
Trusted, independent analytics for the APIs you provide or depend on.
Key Platform Functionality
Monitor secure production APIs

Monitor
Monitor APIs in the runtime where it matters. Get instant alerts for problems.
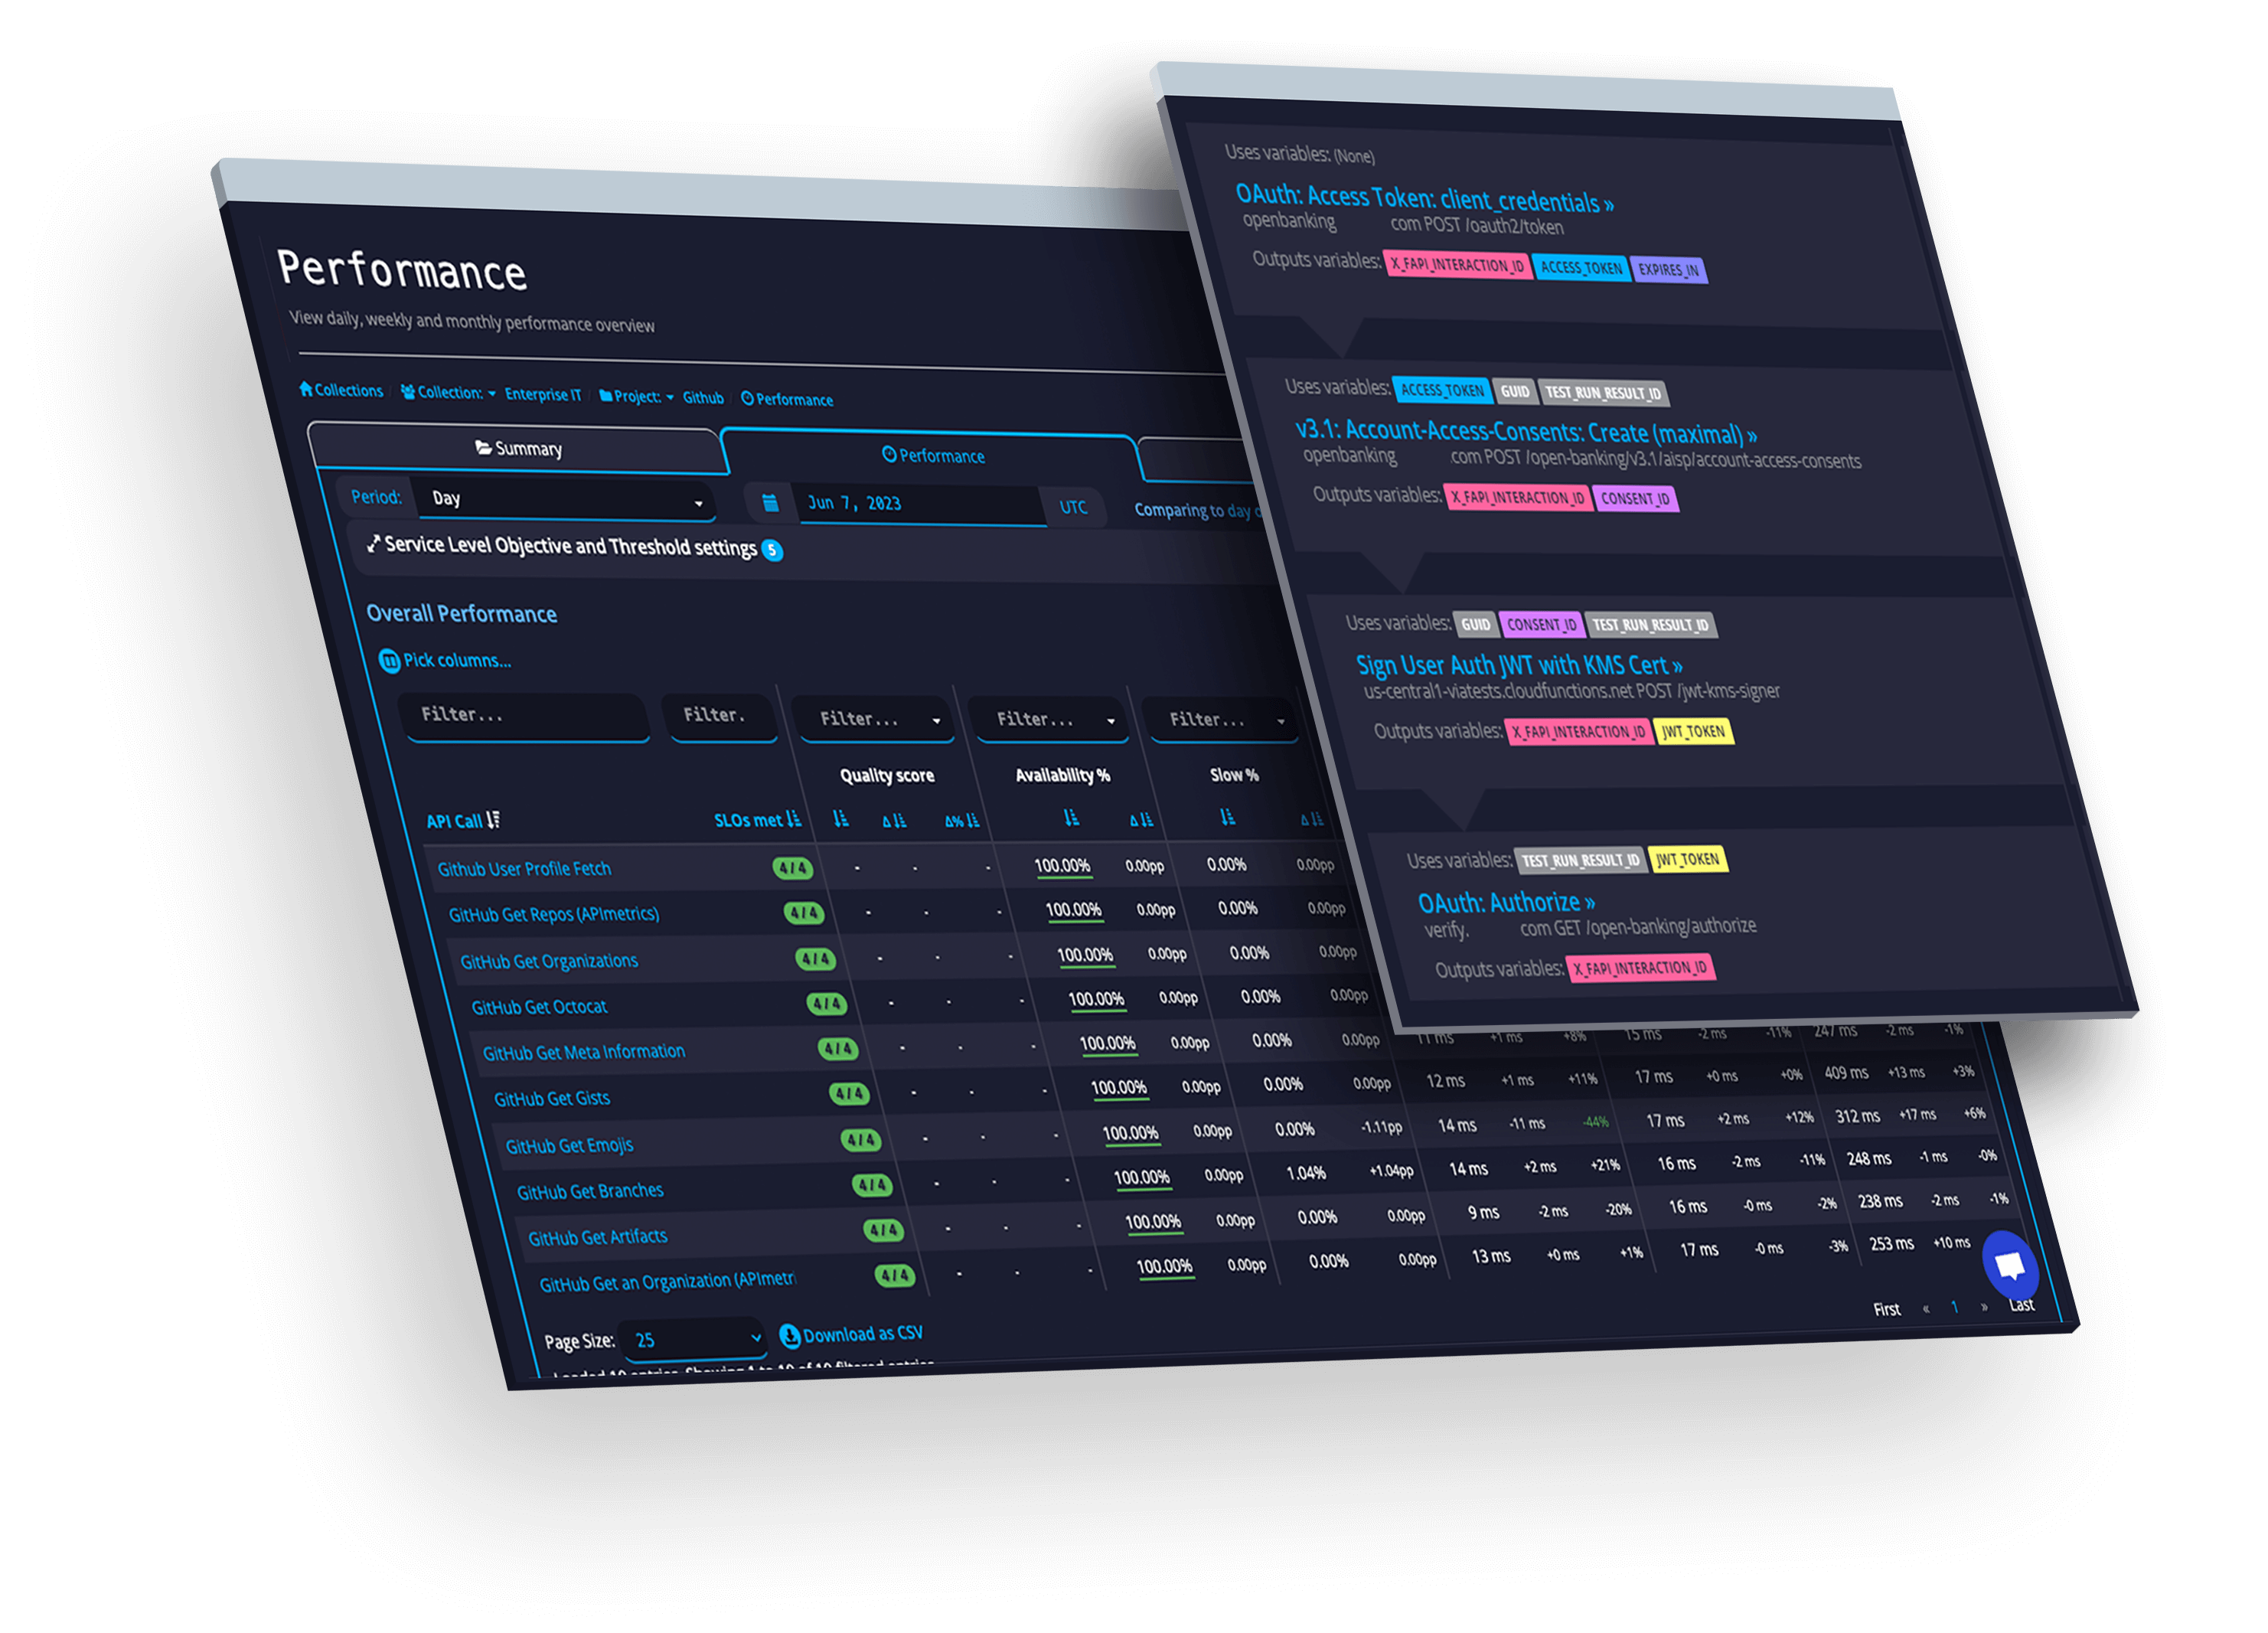
Secure
Monitor and verify runtime security works as expected 24/7.
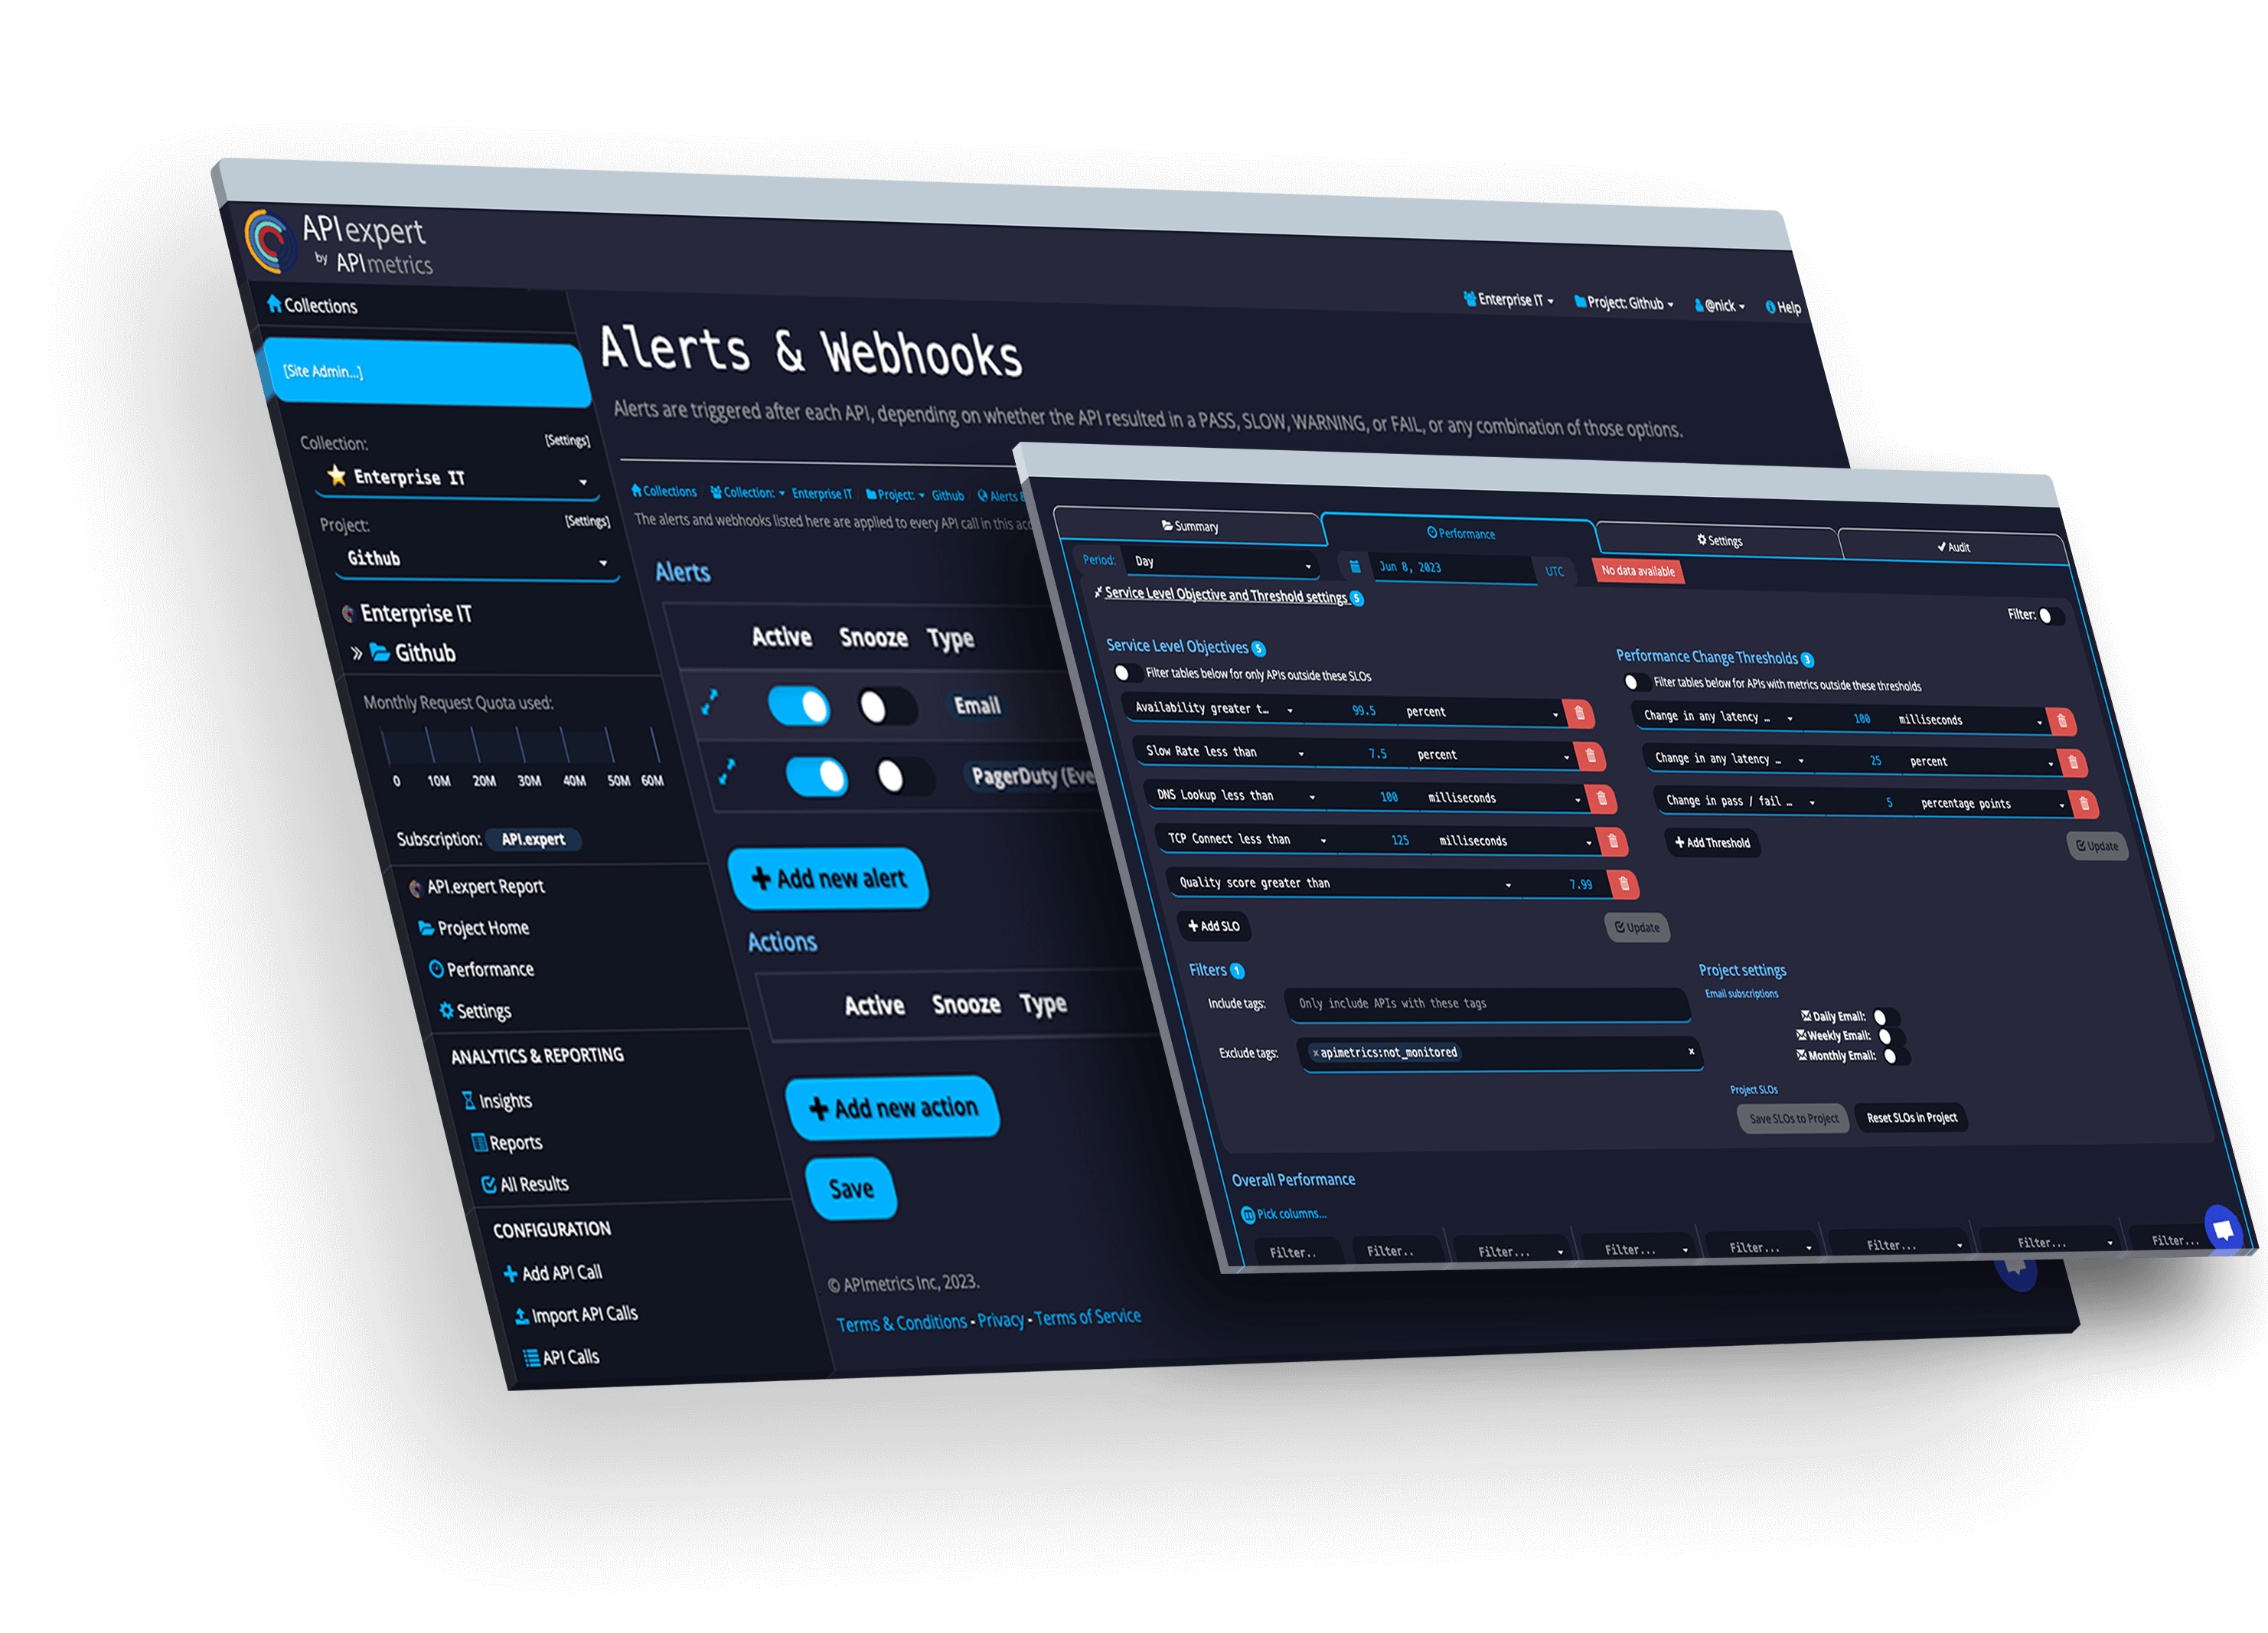
SLAs
Track and manage actionable SLOs & SLAs for the APIs you use and provide.
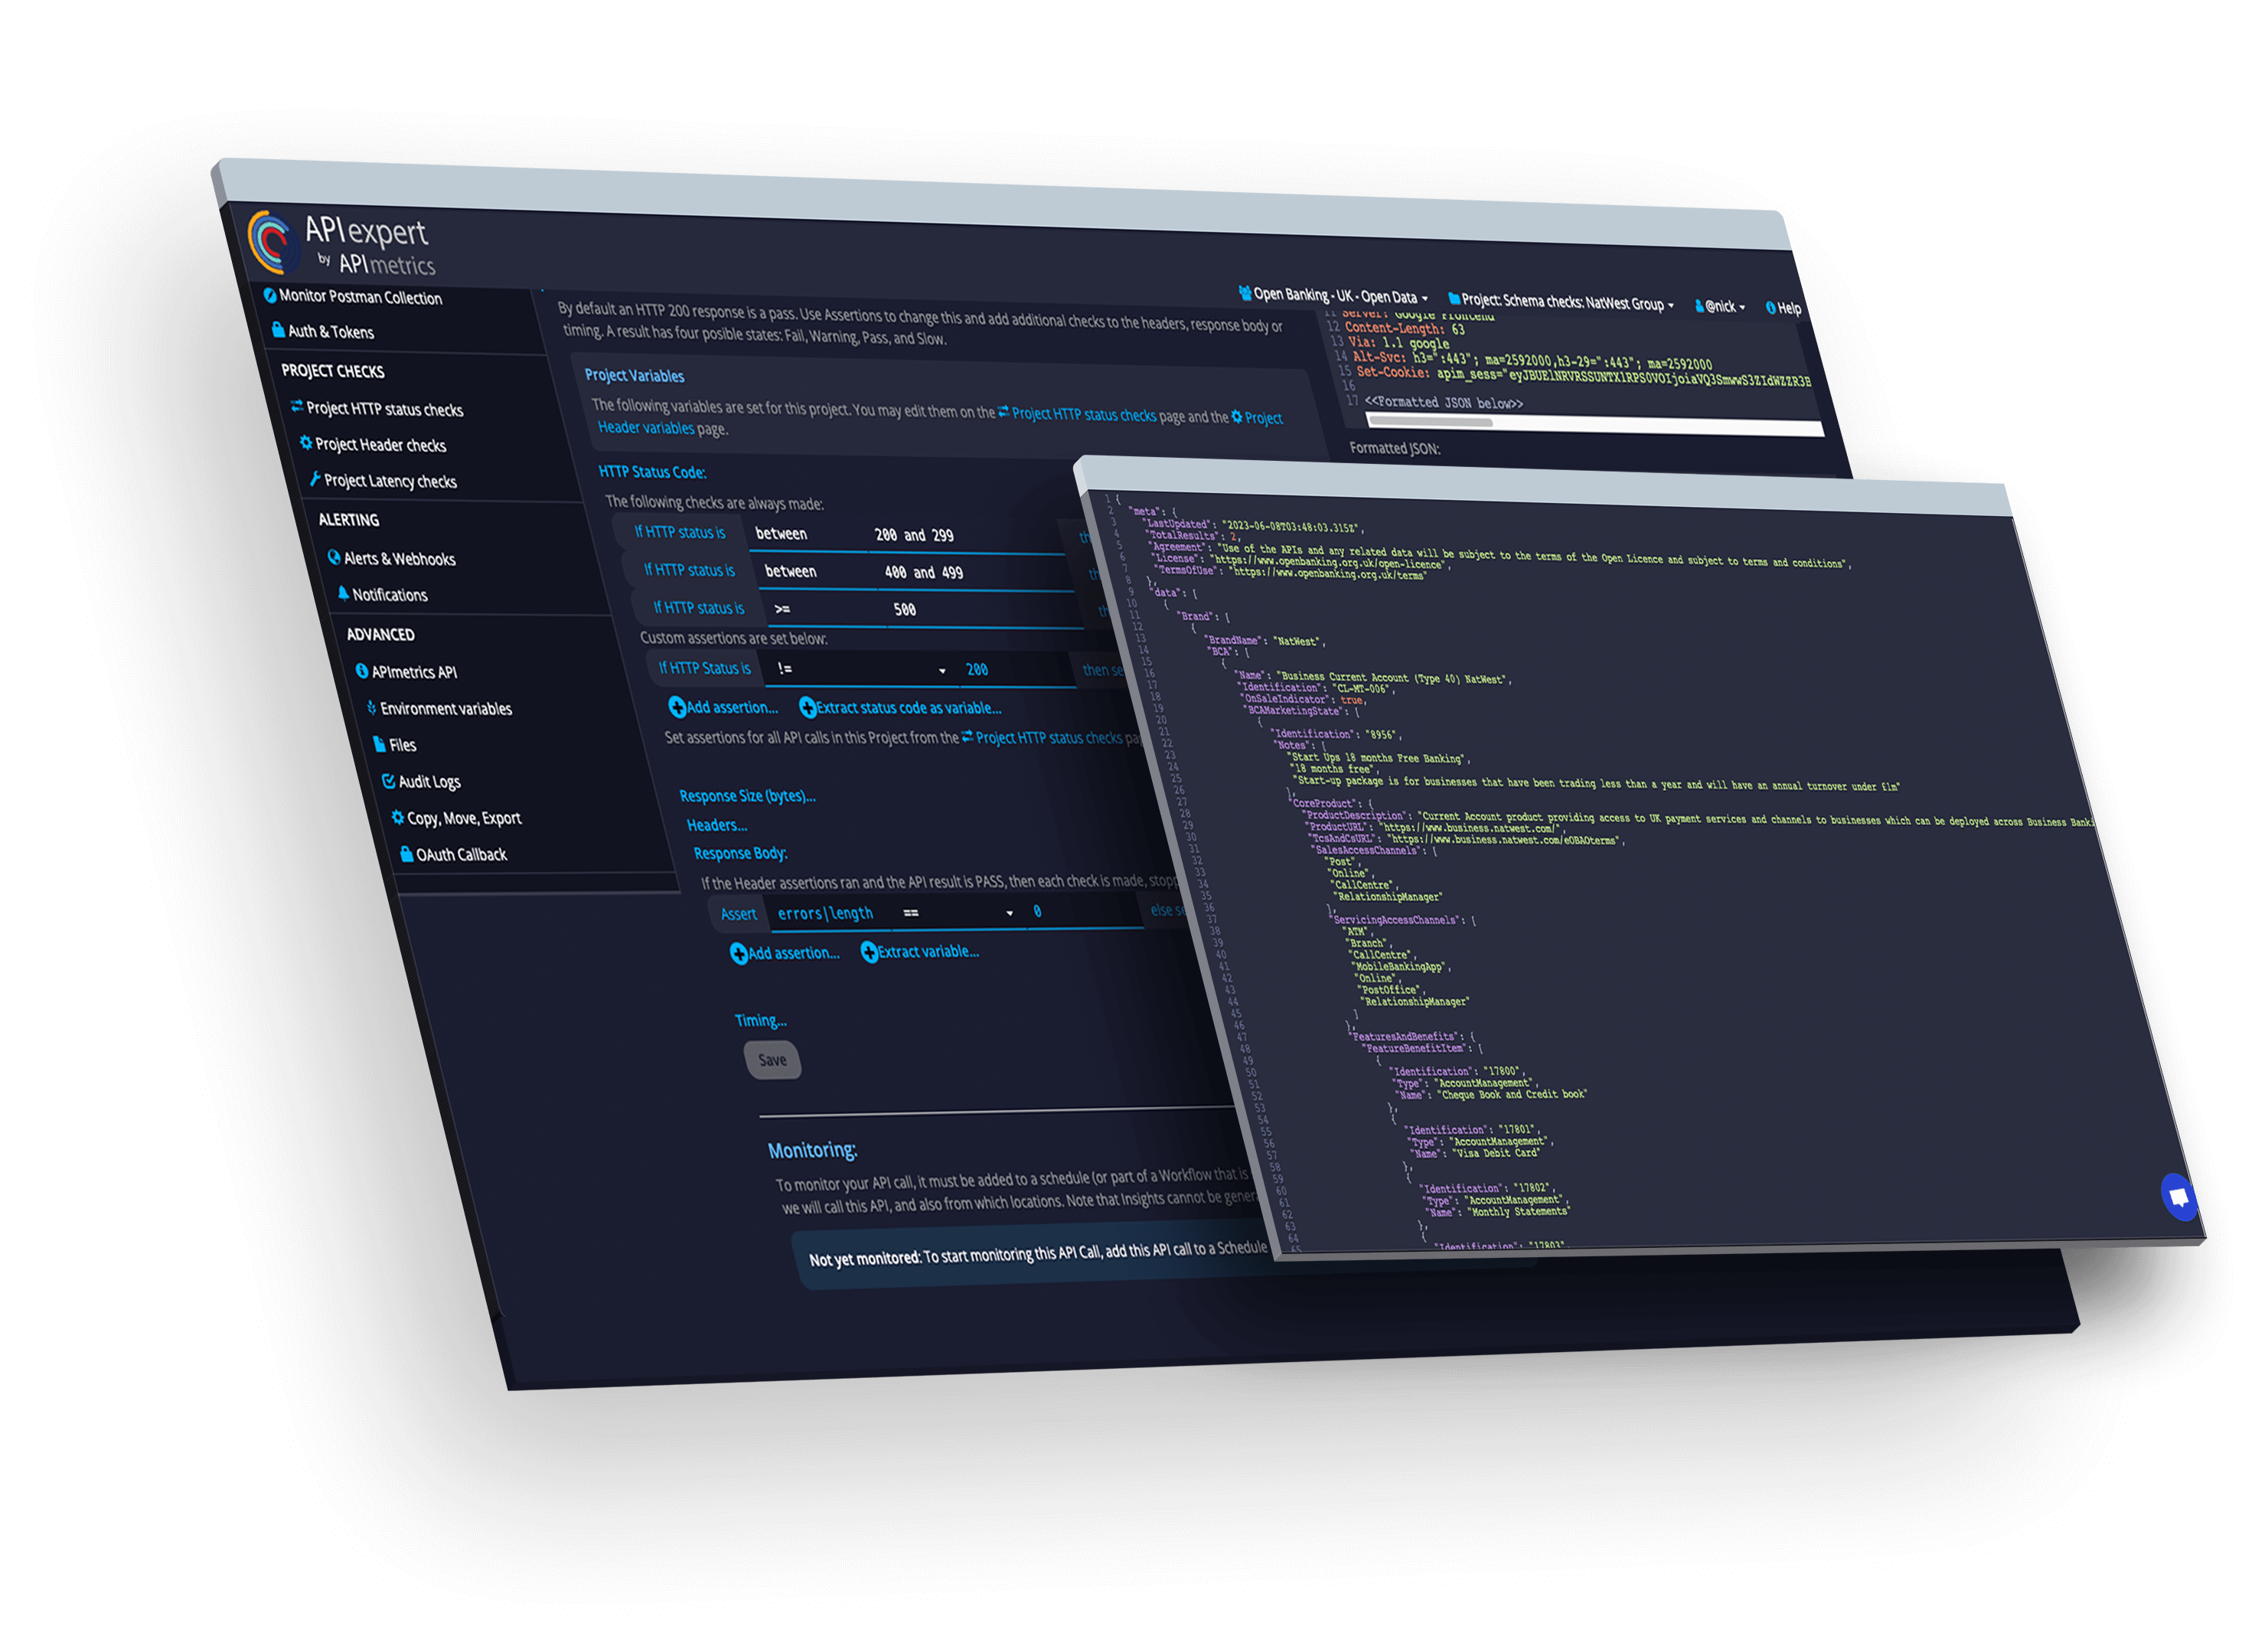
Govern
Validate and verify APIs. Continue to match your designs even in production.
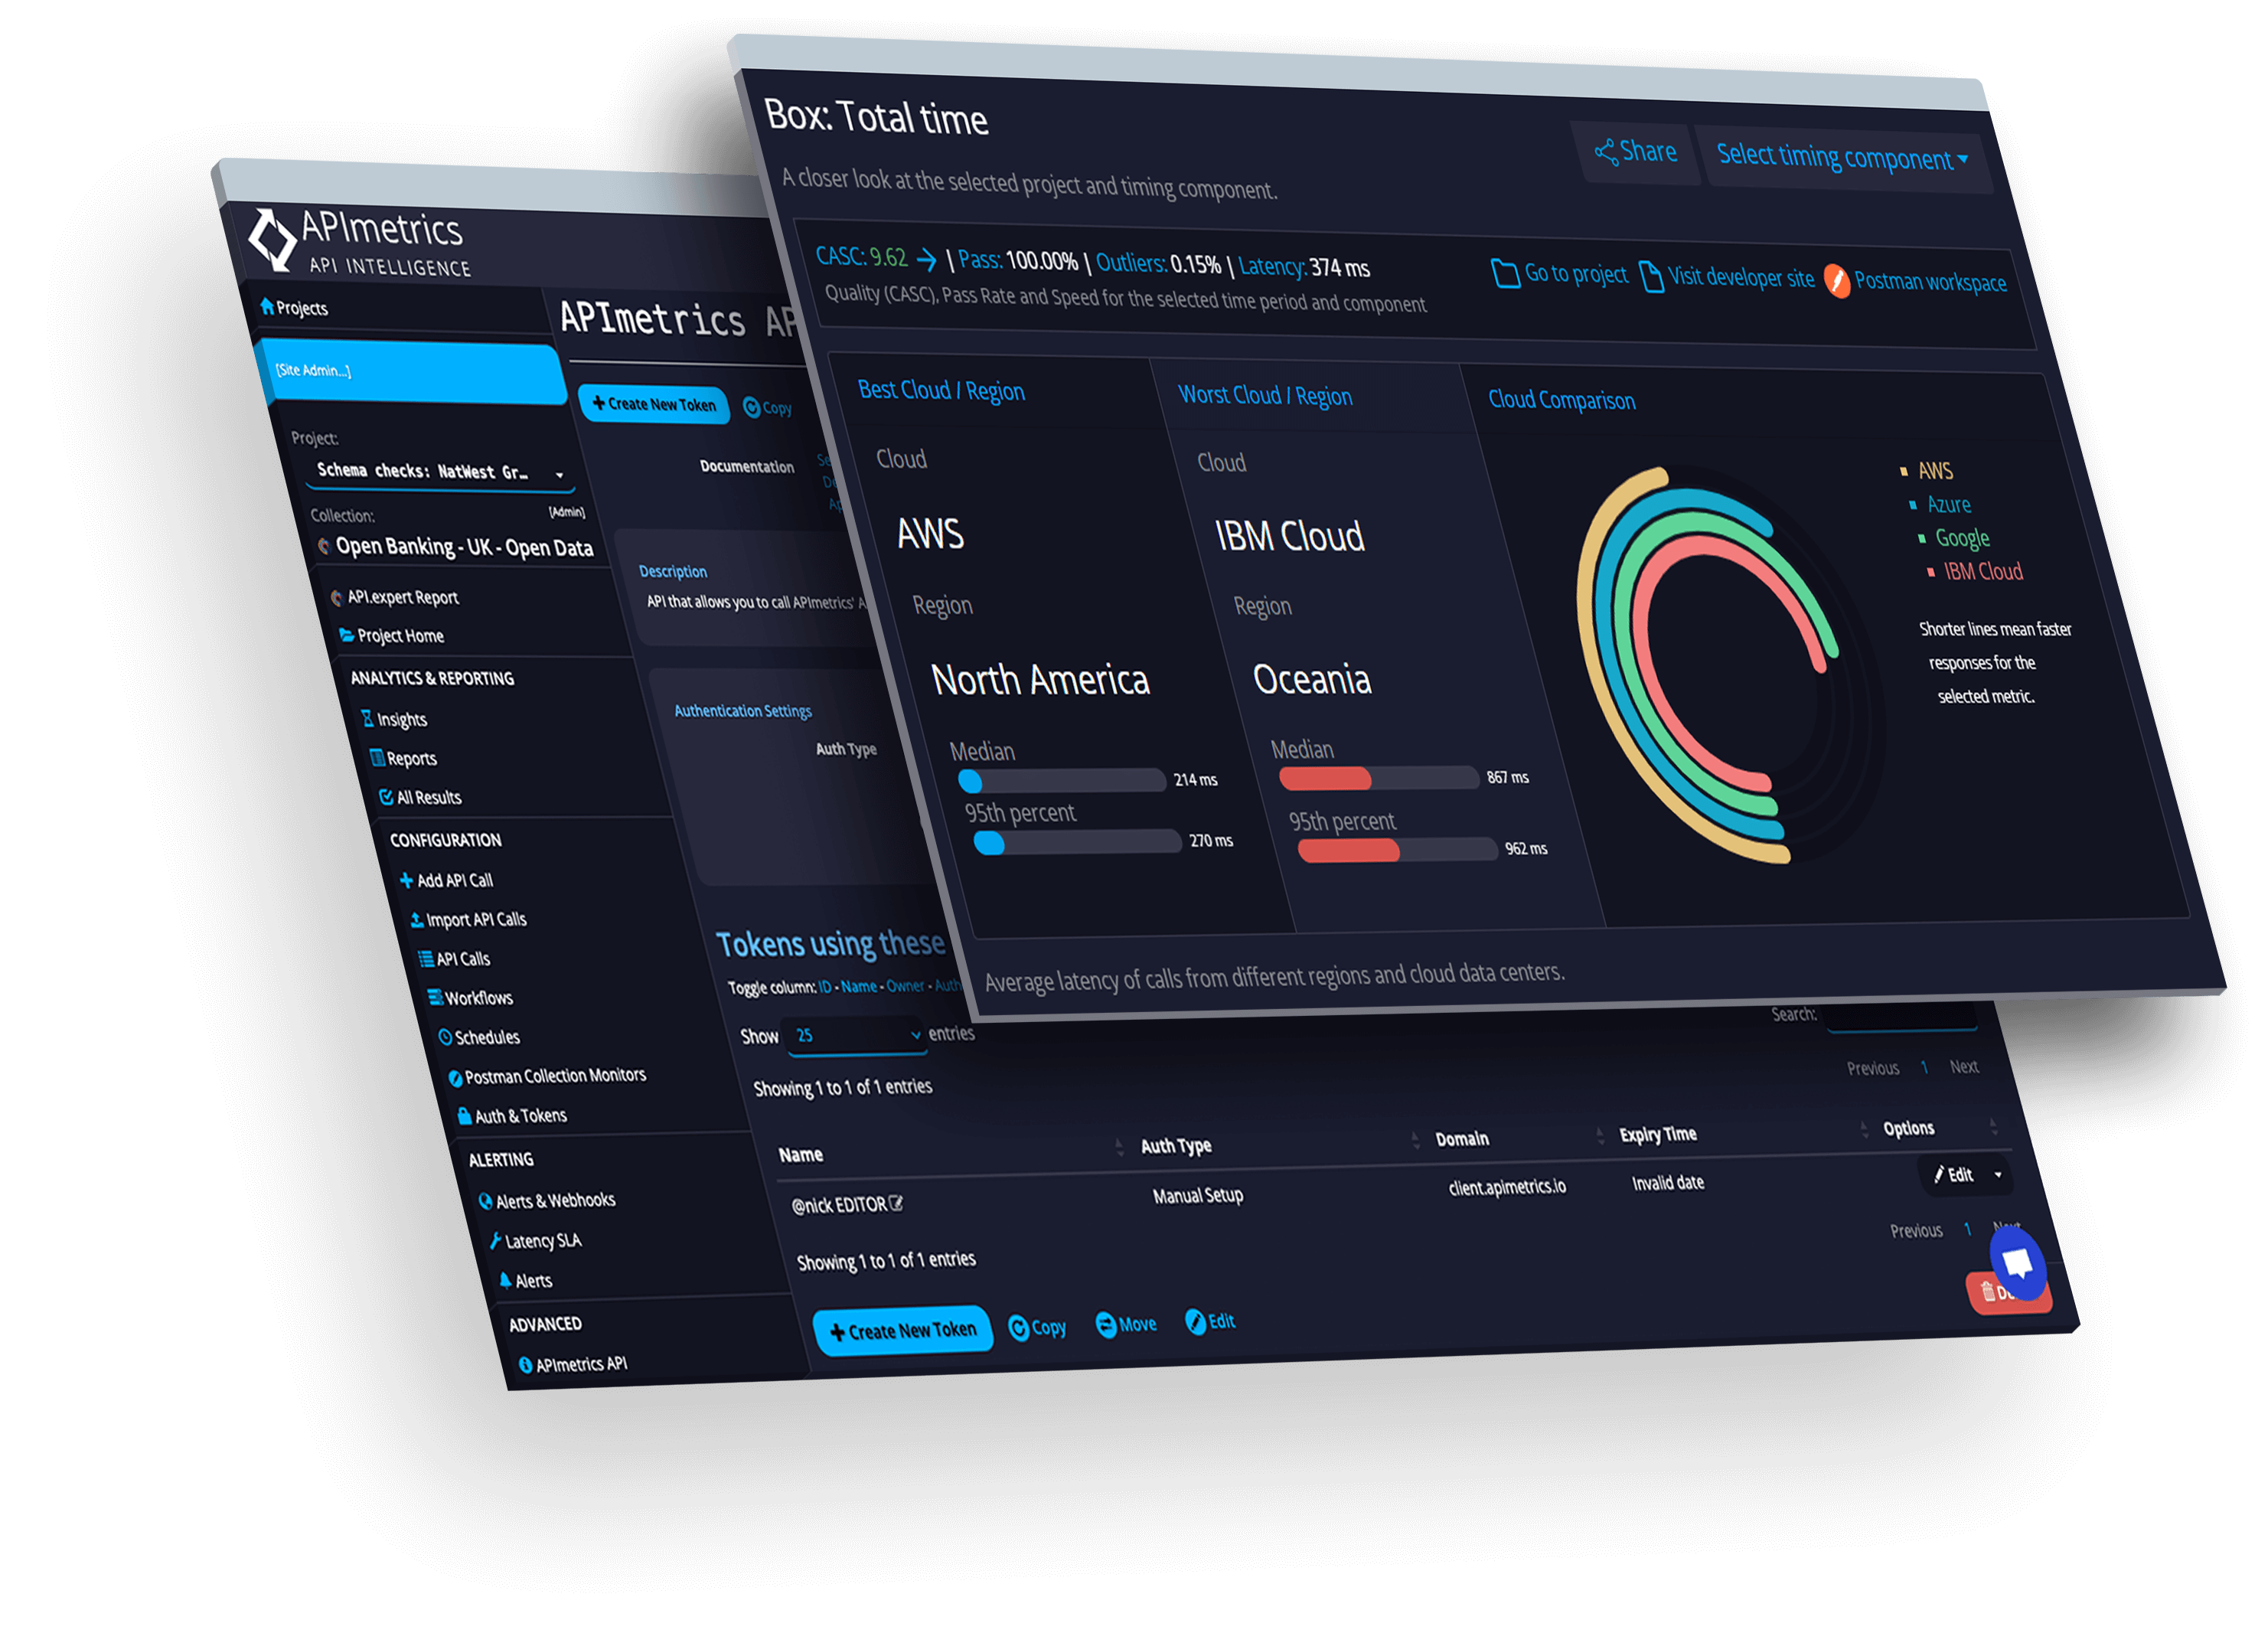
Network
See performance from every cloud in real time.
Ratings
Learn how APIs measure up using our patented scoring technologies.
Monitor
Secure
SLAs
Validate
Network
Rankings


Banking
APIContext helps banks and fintechs of all sizes deliver high quality services and compare how they stack up.
Telecom
Ensuring customer and partner APIs work seamless is part of APIContext solutions for major global scale carriers.
IT
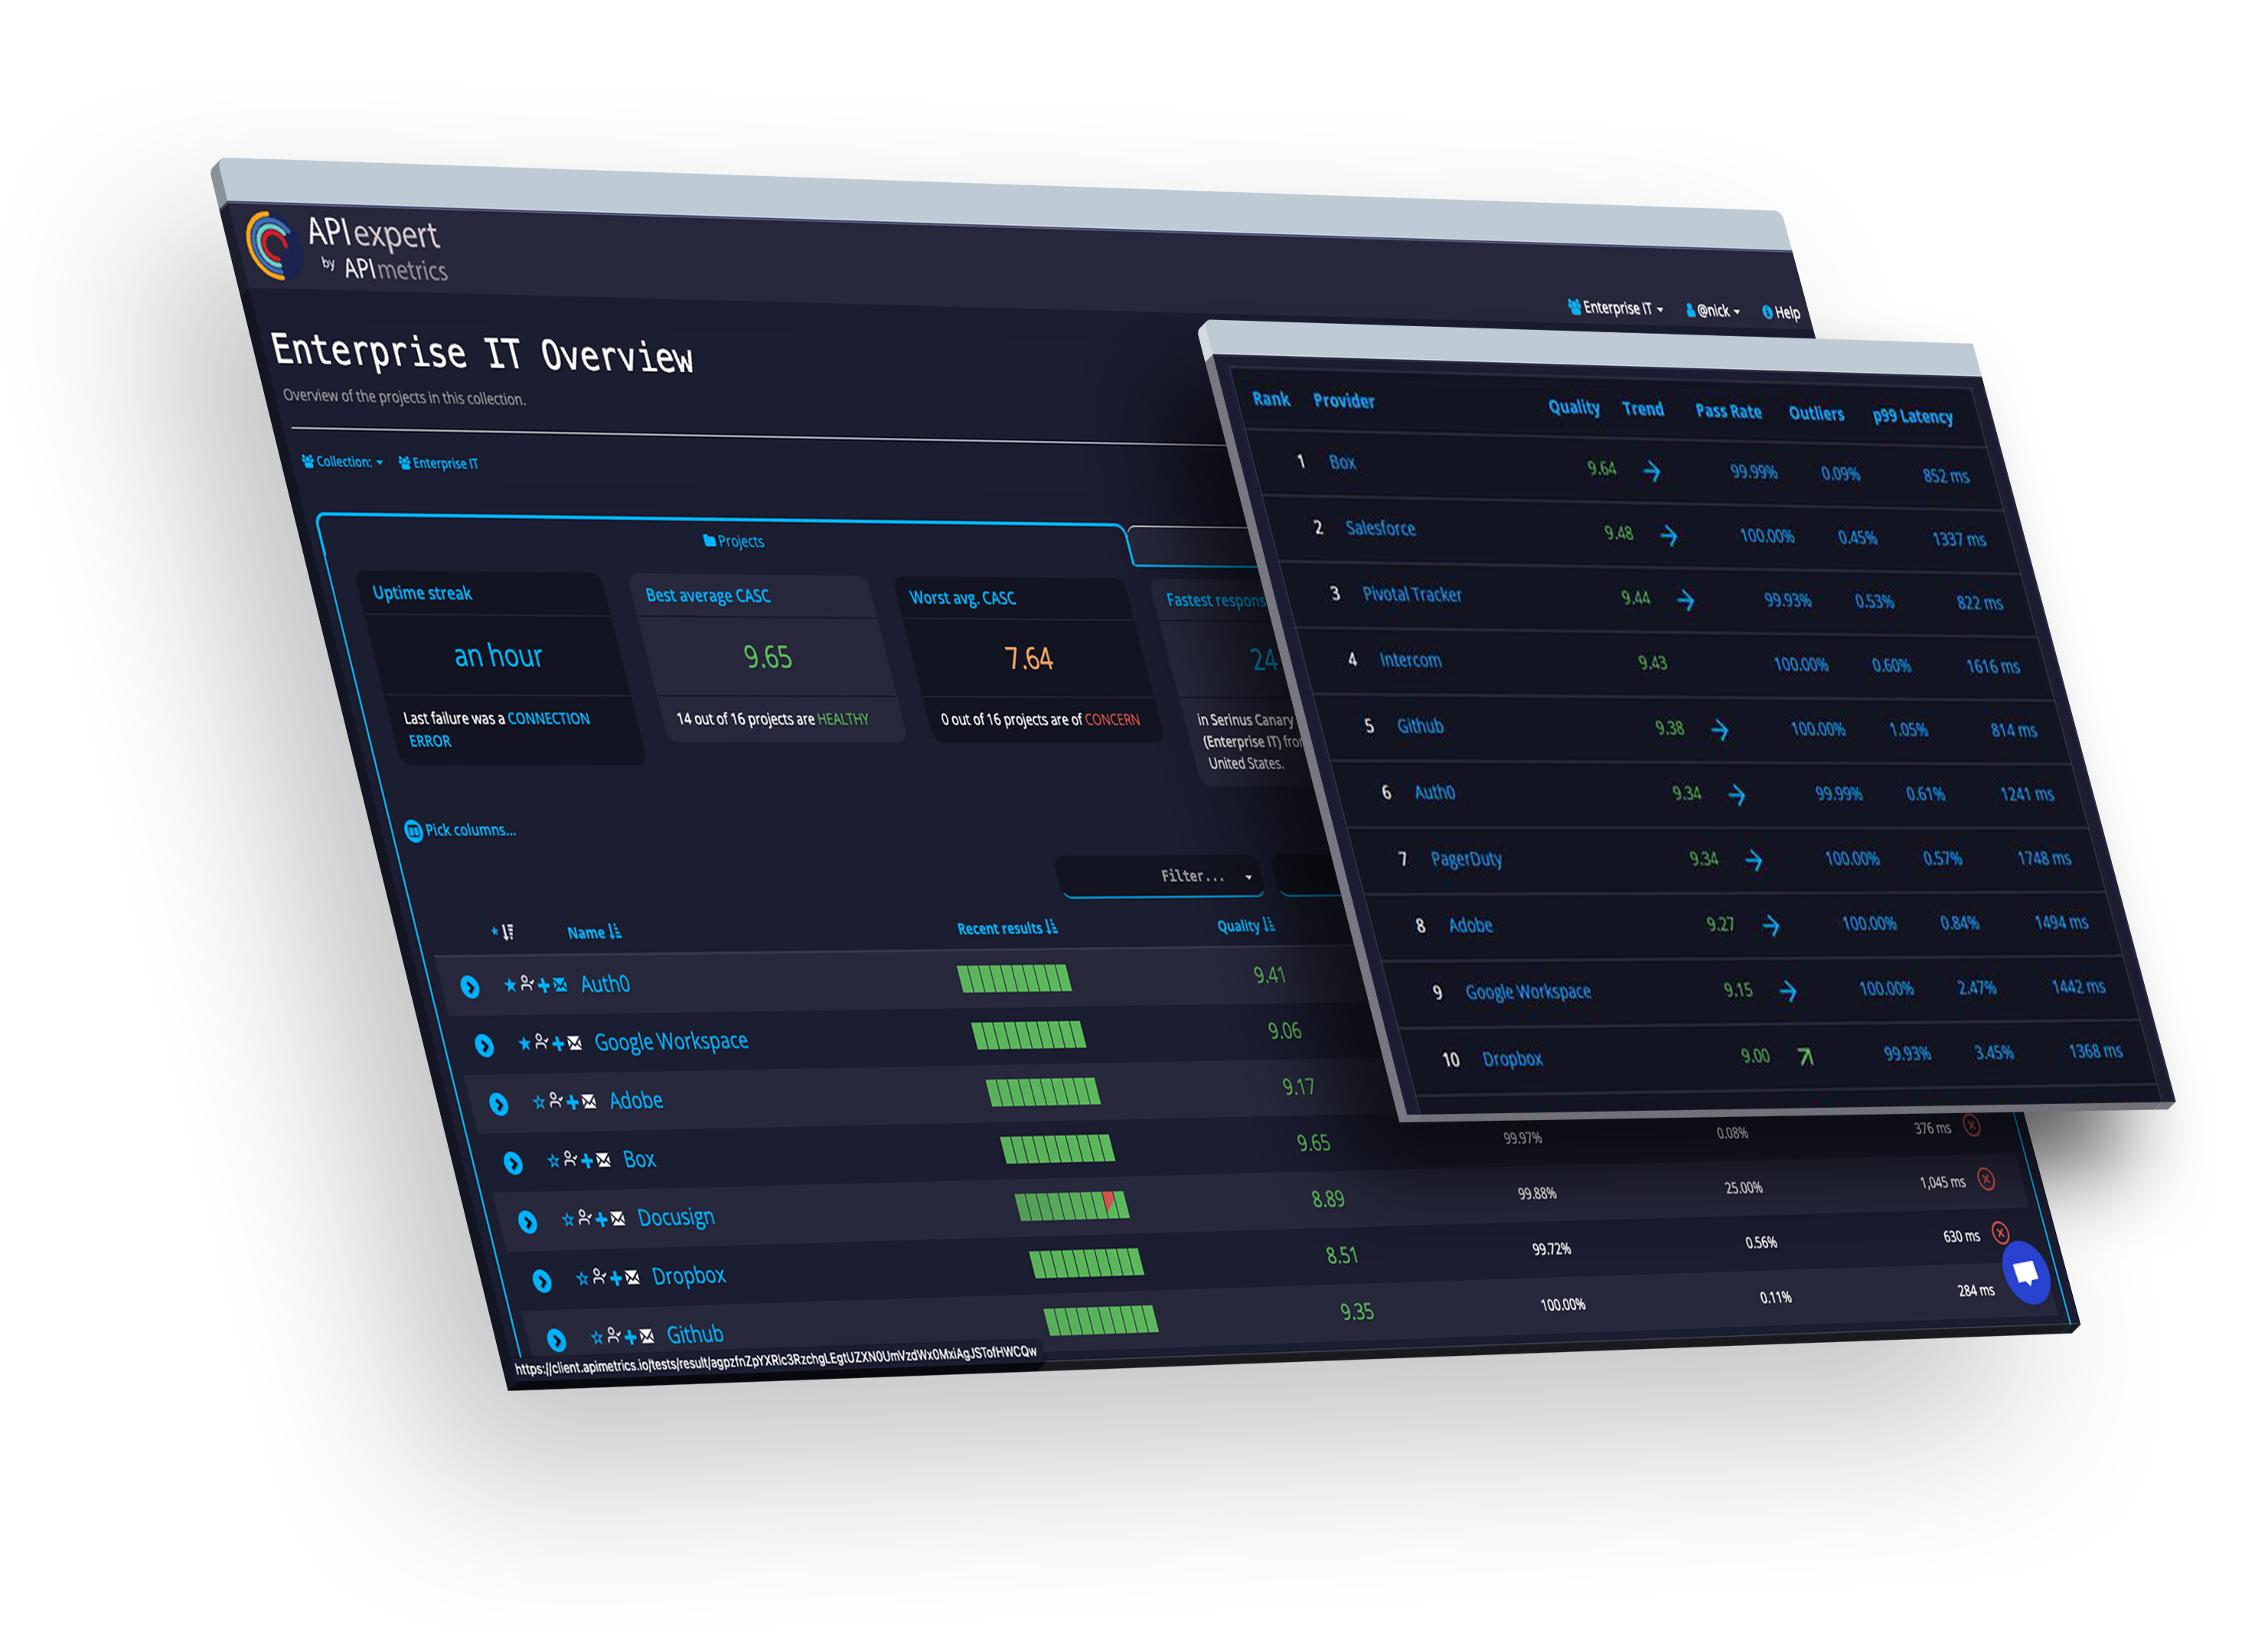
Dozens of leading IT providers rely on APIContext for meaningful SLAs and Performance metrics for their customer success and DevOps teams.
Outcomes
Optimized for security and Compliance
- Trusted, secure production API performance data
- Identify issues before they impact customers and end users
- Product and operations stakeholders leveraging the same unbiased results
- Configure once, monitor always - easy to set up, use, and maintain
- Performance and reliability insights that improve security
Case Studies
Designed For All API Stakeholders & Owners
Banking
Telecom
Government
Client Testimonials
Let's Work Together
Contact Us
Learn how we bring best practices and open standards to API monitoring with integrated API workflows, performance assurance and conformance analysis.